
What does power generation actually cost on the Railbelt today?

I was making a series of graphs to answer a question someone asked me (as I tend to do), and thought I should take a bit of extra time to share it with everyone rather than leaving it to molder in an email thread. As we’re going into the process of planning for future generation on the Railbelt, I think it’s important that we step back and look at the consequences of our past decisions. While fuel represents about 28% of an average Railbelt power bill, the generation system as a whole brings that up to 50%.
There are four main components of power plant cost.
Fuel is fuel. Some amount must be used just to keep the plant alive even if it’s not exporting power to the grid, but mostly this follows plant usage.
Non-fuel production expenses are all the operating and maintenance related expenses. Some of these change based on how much the plant is run, while others don’t.
Depreciation cost represents the cost of having built the plant, and ratepayers pay a chunk each year that’s designed to reach zero when the plant is retired (that way everyone who gets that plant’s power pays a piece of the capital cost). That’s a sunk cost, regardless of what you do next, but it’s significant, and every time we build a power plant, we lock that cost in for future ratepayers.
When a utility buys power, they pay a purchase price that lumps all these costs together -- when a utility isn’t the owner of a power plant, they pay either a set rate per kilowatt hour (to most independent power producers) or a percentage of annual costs (Bradley Lake hydro), or a rate set based on the cost of all their other plants (very small independent power producers and consumers with excess home solar production).
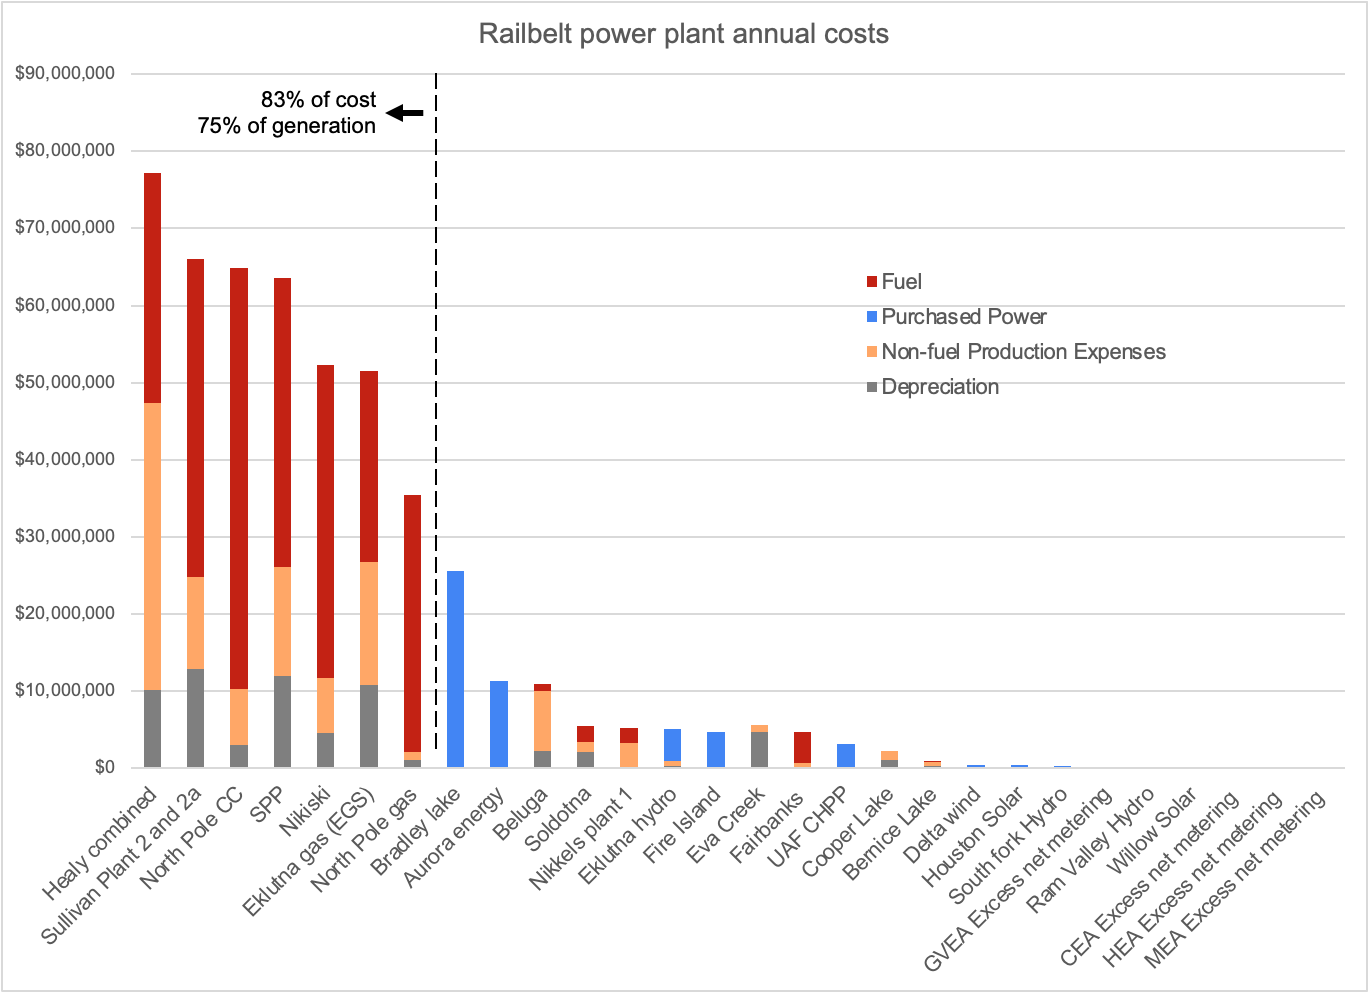
Data from 2024 and 2025. Excludes a few very small plants and plants that are net energy consumers.
A handful of heavily-used fossil fuel plants make up a large majority of the roughly $500 million cost, and produce most of the electricity. Around $27.5 million is for backup fossil fuel plants used at less than 10% capacity, and the remaining $60 million is a combination of small renewable plants and purchased power, primarily from Bradley Lake hydro, but also from small hydro, wind, solar, and coal.
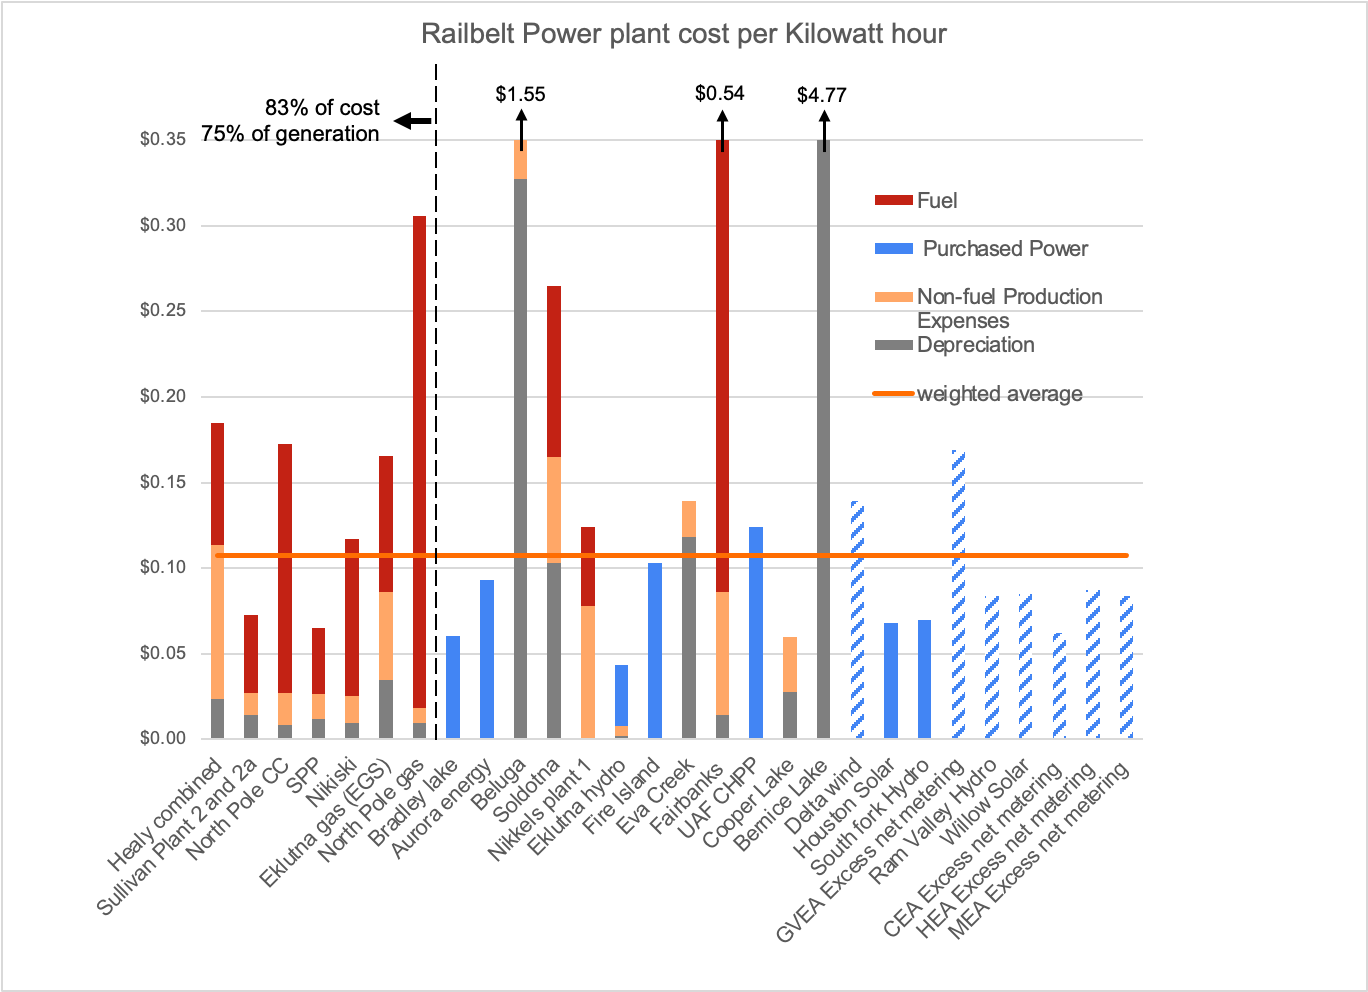
Per kilowatt hour, you get a different picture. The least-used backup plants are off the chart because they produce so little power that the per unit price is pretty meaningless. But even the heavily-used plants vary widely. GVEA’s coal and oil plants are very expensive. The gas plants run by CEA are relatively cheap. The weighted average cost is around 11 cents per kilowatt hour. Most of the purchased power is cheaper than the weighted average, from various renewable projects and a coal-fired combined heat and power plant in Fairbanks.
The patterned blue bars on the right side of the sheet include overproduction by net metering customers (excess within a month), and very small renewable projects. The purchase price for these isn’t set through a contract, but changes quarter to quarter and tracks the power costs of the utility it’s sold to through “avoided cost” or the “small facility purchase power rate.”
GVEA
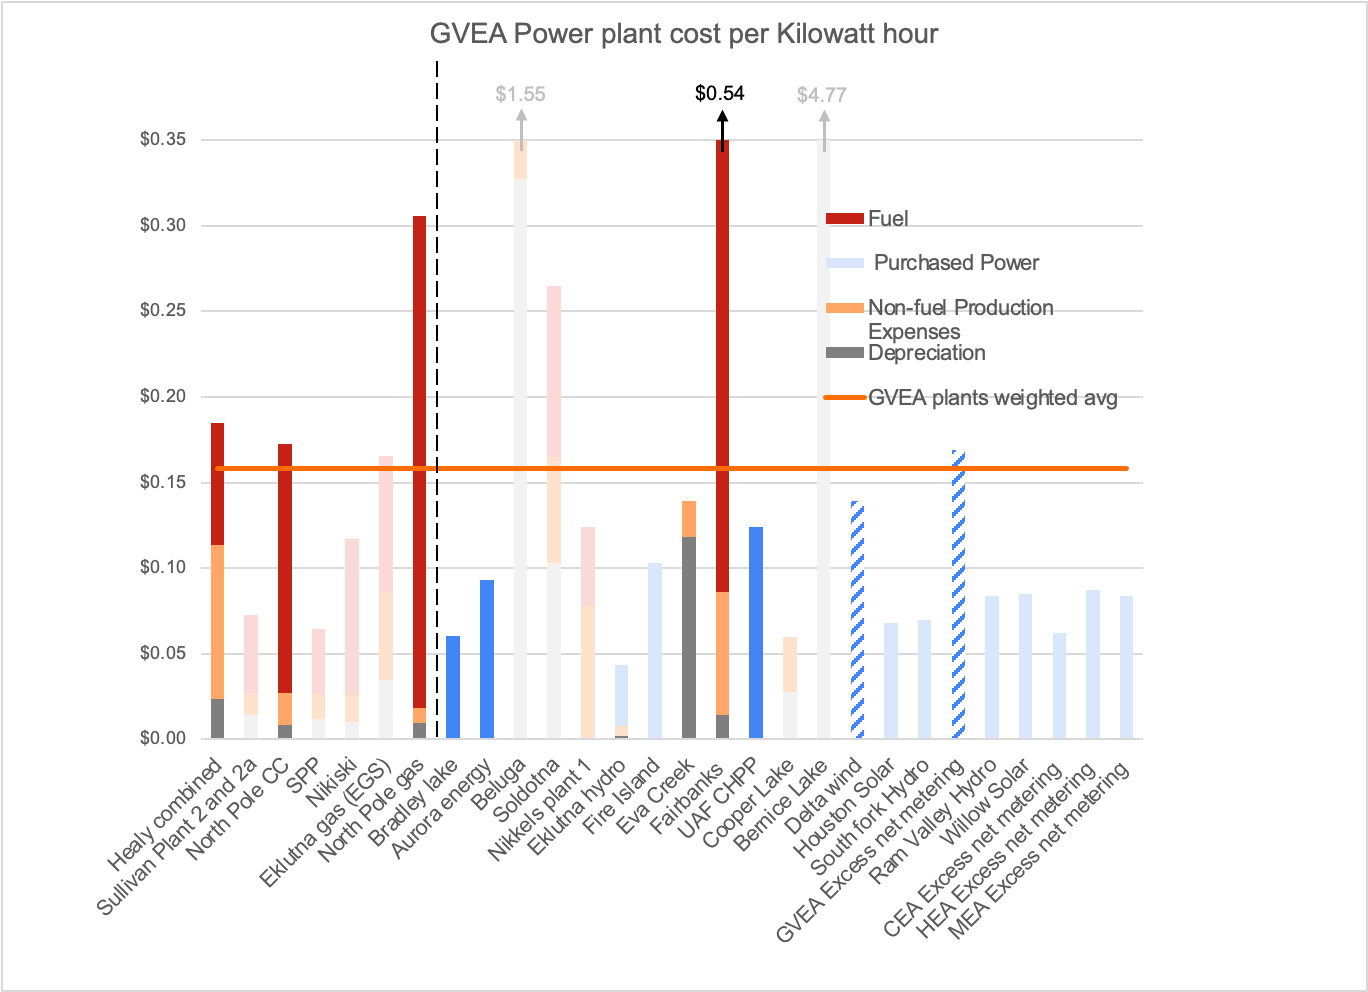
Most of GVEA’s power comes from oil and naphtha-burning plants with huge fuel costs, or from coal power with high operating costs. Since there is no longer excess gas in Southcentral, they can’t dilute these costs by buying power from other utilities. This also means GVEA has to run its backup plants more often to meet peak demand. With a higher overall cost, the price it pays to the smallest producers also tracks higher than other utilities.
MEA
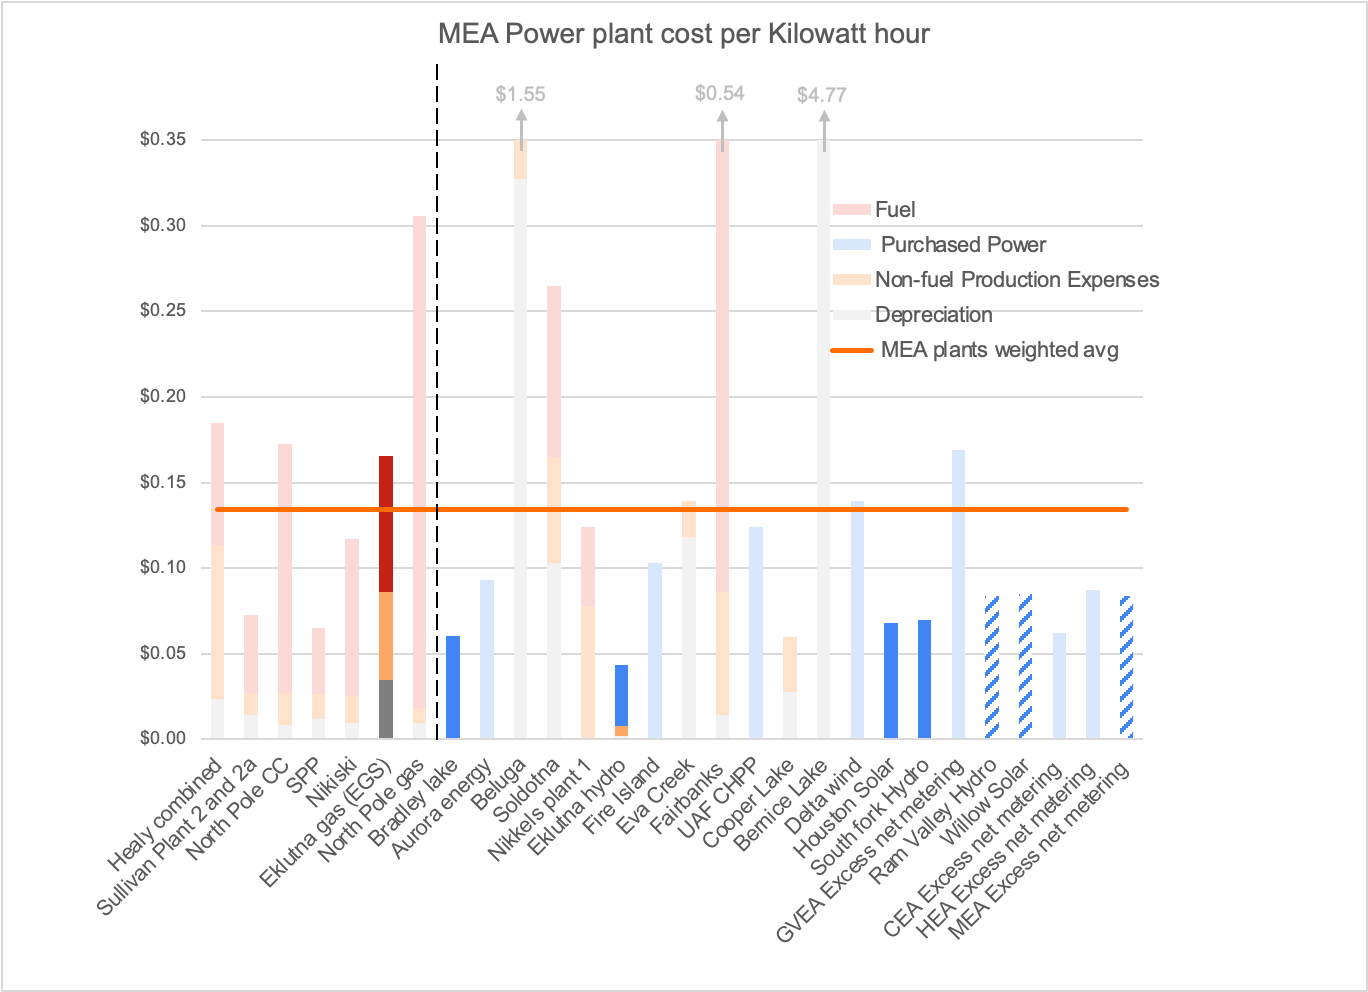
MEA only owns one power plant. That plant’s cost per kilowatt hour has increased in recent years, partly due to gas costs, but largely due to lower use, because MEA operates in a power pool with CEA, and most of its power comes from CEA’s more efficient gas plants. It also buys power from a number of small renewable facilities, some under contracts, and some under the automatically calculated rates.
CEA
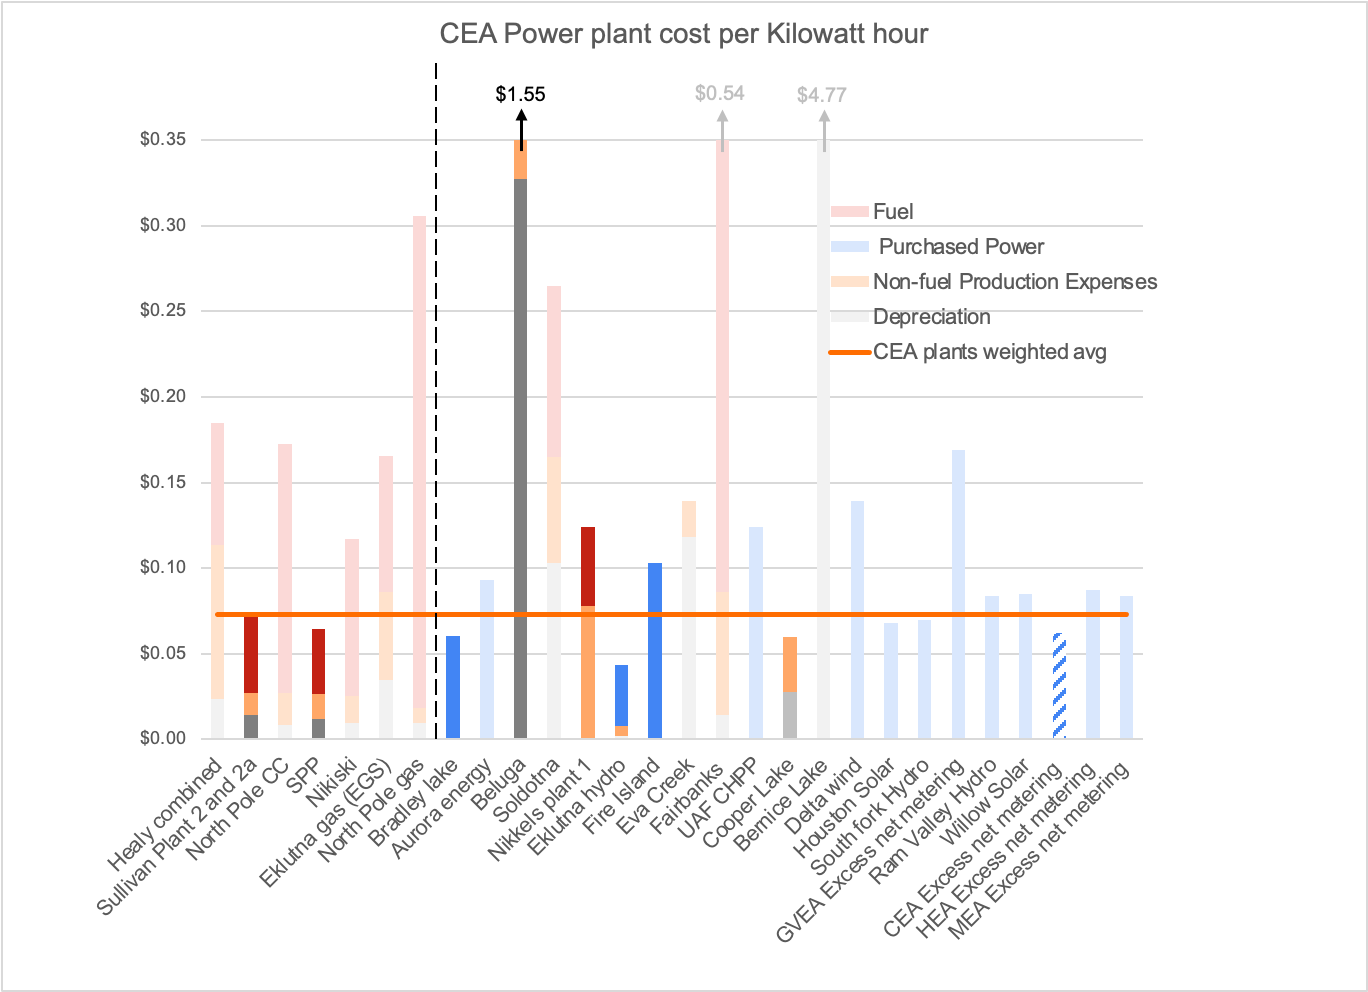
CEA has access to most of the cheaper power on the Railbelt. Their two main gas plants are more efficient than the other gas plants (MEA and HEA plants use around 17% more gas per kilowatt hour). The gas itself is also cheaper, since CEA gets most of its gas from the gas field it owns. However, it also spends a significant amount on the backup Beluga gas plant, which is little used. CEA also hasn’t filed a 2025 annual report yet, so gas costs are likely a bit higher than shown here.
HEA
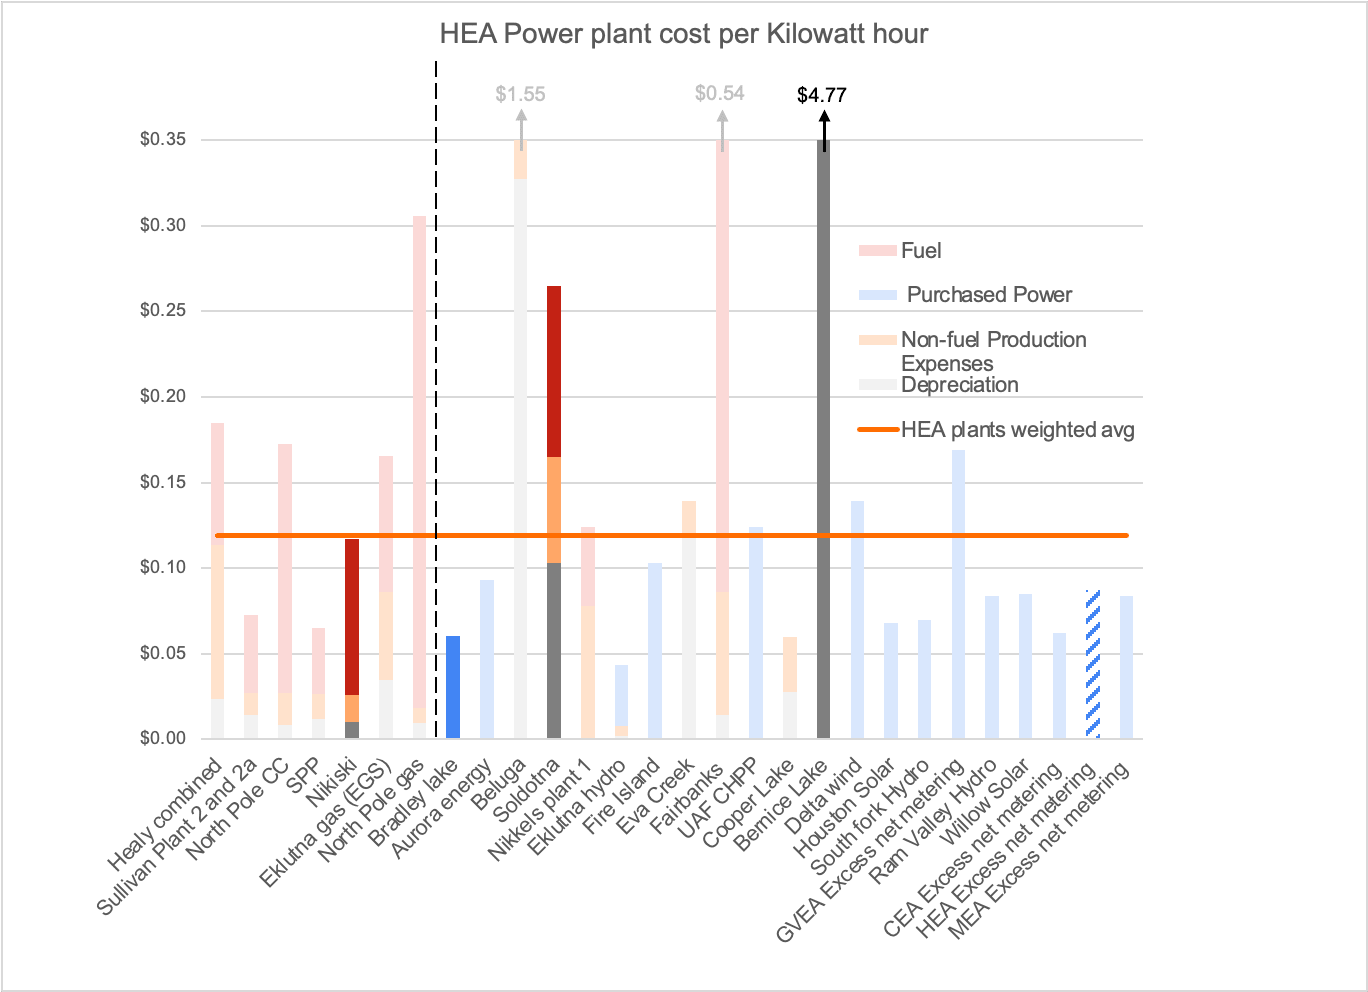
HEA has the most expensive gas contract on the Railbelt. Its primary gas plant has a similar efficiency to MEA’s plant, but is used more heavily. Both its backup gas plants are very expensive. Bernice Lake is a very old plant, while Soldotna is one of the newer plants on the Railbelt (2014), but is used at only 5-10% capacity. Combined, these backup plants make up around 10.5% of HEA’s generation costs, and provide about 4% of its power.
Without depreciation
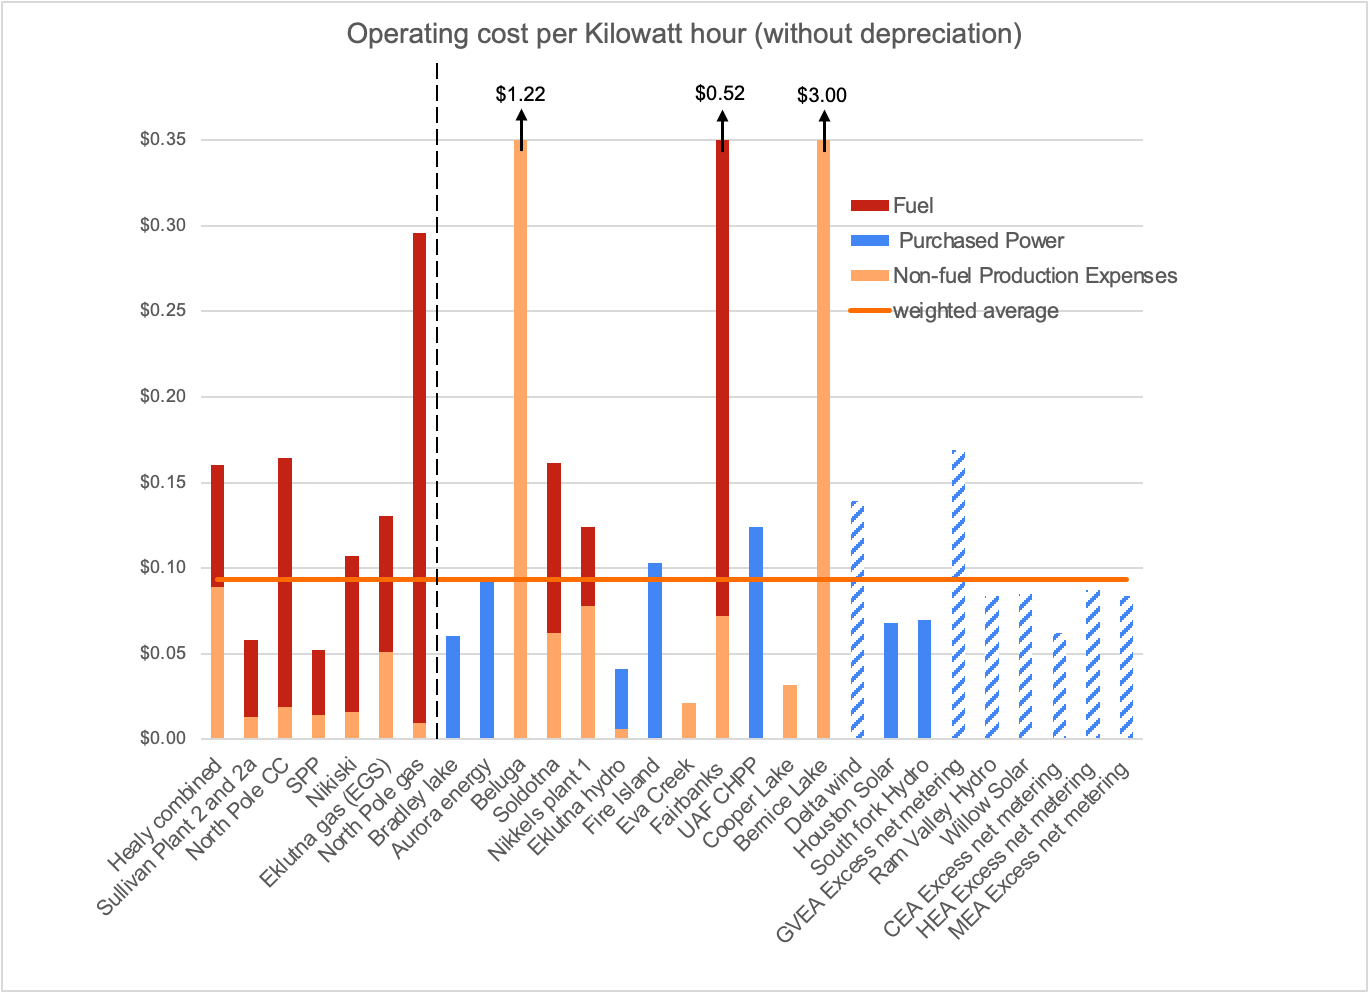
Depreciation is a useful way to think about the economic consequences of what we’ve already done, but if we want to compare new options to existing ones, it makes more sense to look at the fuel and operating costs, since those costs can still change. And those costs are all over the place. Even quite expensive new generation could pencil out immediately if it replaces very expensive GVEA generation, or the lesser used gas plants. But it would be significantly harder to match the current costs of the cheapest gas plants.
But the cost of those cheaper plants is also likely to go up.
With high/imported gas costs
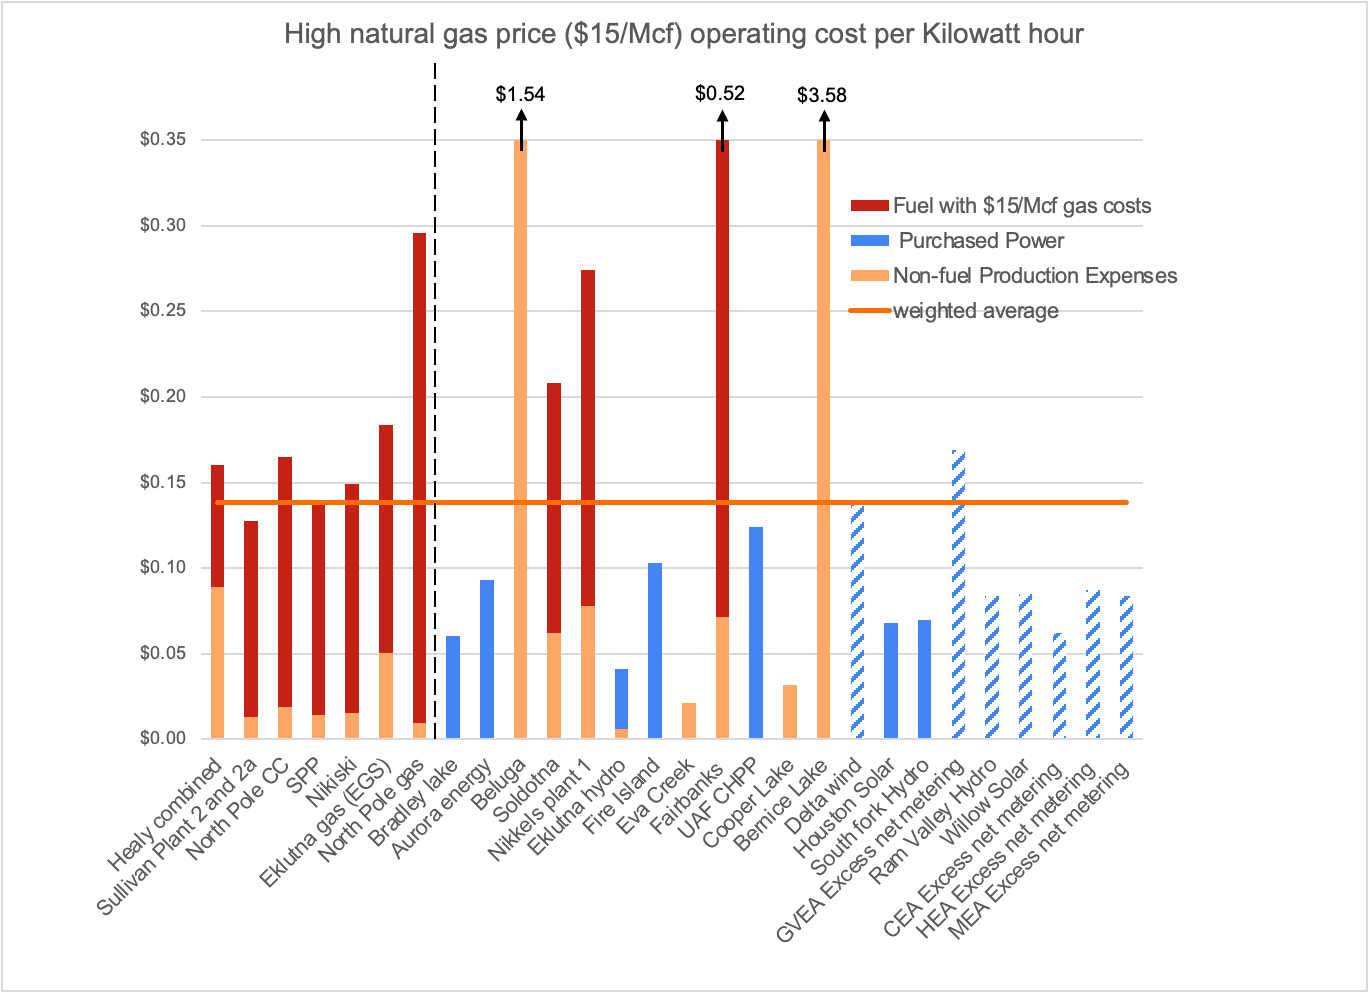
Operating and fuel costs are a moving target. All costs will increase over time, but a major current driver is the Cook Inlet gas crisis. This is what the same data would look like if all natural gas cost $15/Mcf (current costs are around $8-10/Mcf, depending on utility). The weighted average would be around 14 cents per kilowatt hour, and likely higher when shifts in operating costs and other fuel costs are included.
Economic Dispatch
There’s been a lot of talk in recent years about “economic dispatch” on the Railbelt -- where plants would be turned on and used in the order of which is cheapest, rather than which utility owns them. Clearly, the plant costs vary wildly. And one study has shown around $42 million/year in potential benefits -- which is small compared to the overall cost of running the Railbelt (around $975 million), but still meaningful.
However most of these savings come from shifting some power production from expensive GVEA oil and coal plants to cheaper gas plants. That requires not just an organizational solution, but also a solution to the Cook Inlet gas crisis. If there’s no gas to spare (like today), none of that shifting can happen. If the gas is expensive (like in my final chart), the shifting will do much less good. Economic dispatch could set up a useful framework, but likely also requires different generation sources to have a major impact.
Data notes
Operating costs for each power plant are from RCA annual reports (FERC form 1). Purchased power and fuel costs for each plant are from the same annual reports or from quarterly COPA filings. Depreciation costs are from each utility’s most recent depreciation or cost of service study. I only included costs directly attributed to a specific power plant, which excludes interest payments for debt due to power plants, transmission, and any share of a utility’s more general costs. Most plants have been updated to 2025 values, but some are 2024 based on lagging annual reports from CEA and GVEA. Eva Creek hasn’t reported operating costs since 2022, so I used 2022 operating costs combined with 2024 depreciation and generation numbers.