

We’d all like lower electric rates. On a year-to-year basis, there’s not a lot anyone can do to change them. Most of a utility’s annual budgeting process comes down to “yep, still going to run the plants, answer the phones, and clear trees off the lines,” with some nibbling around the edges. But these ordinary operations are punctuated by big decisions, and over time, different utilities end up with dramatically different costs.
So I graphed all the residential electric rates and utility costs for the Railbelt and a couple other utilities as far back as I could find and asked “Why?” This was perhaps an overly ambitious question…
In the past couple decades, rate increases in most of the US have been driven by transmission and distribution costs, with generation costs decreasing. In Alaska, it’s the opposite. Our rates have been driven by generation costs.
Fuel prices drive rates up, while decreasing fuel dependence can lower them. The pattern on the Railbelt has been an investment in expensive new plants that reduce gas consumption, but so far cost more than they save.
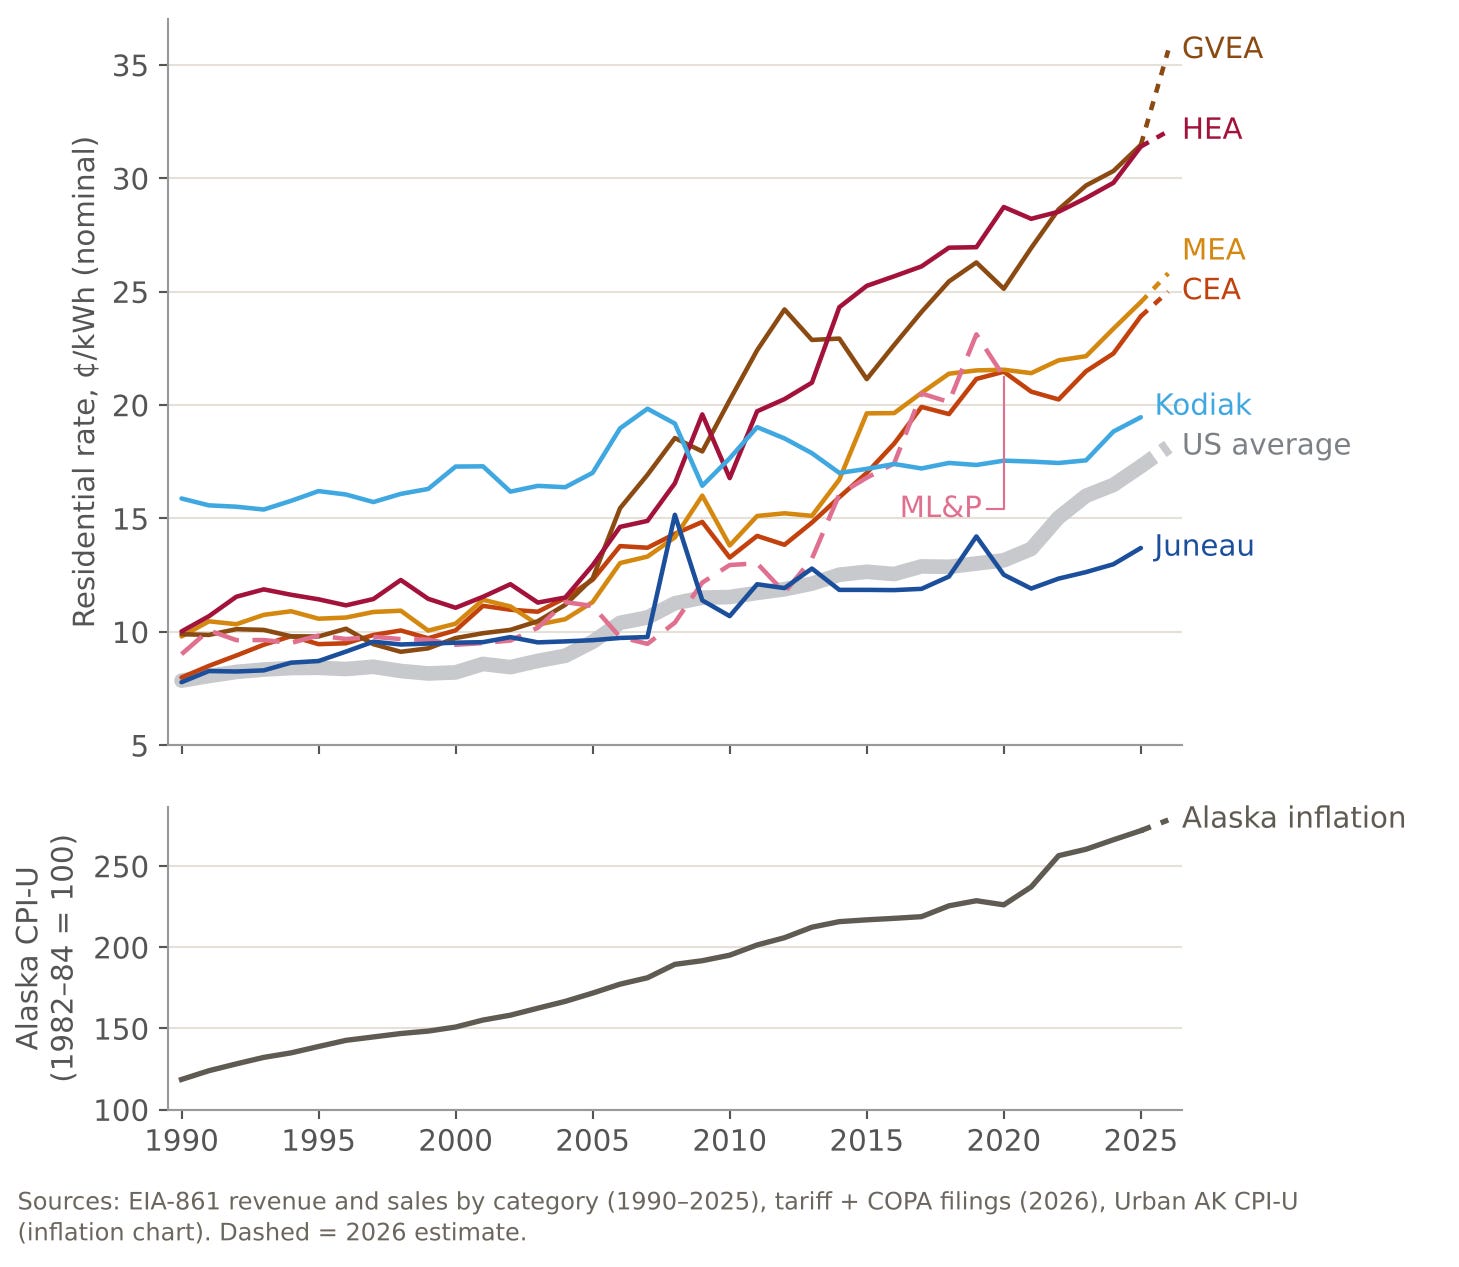
Rates go up with inflation
This is an obvious and boring answer, and I’ve inflation-adjusted all my subsequent graphs to remove it. However, inflation itself is hurting people by driving all their costs up. And since inflation impacts nearly everything, even a successful effort to make energy cheaper often means costs still rise, just slower than inflation.
Utilities that don’t burn fuel saw their rates drop
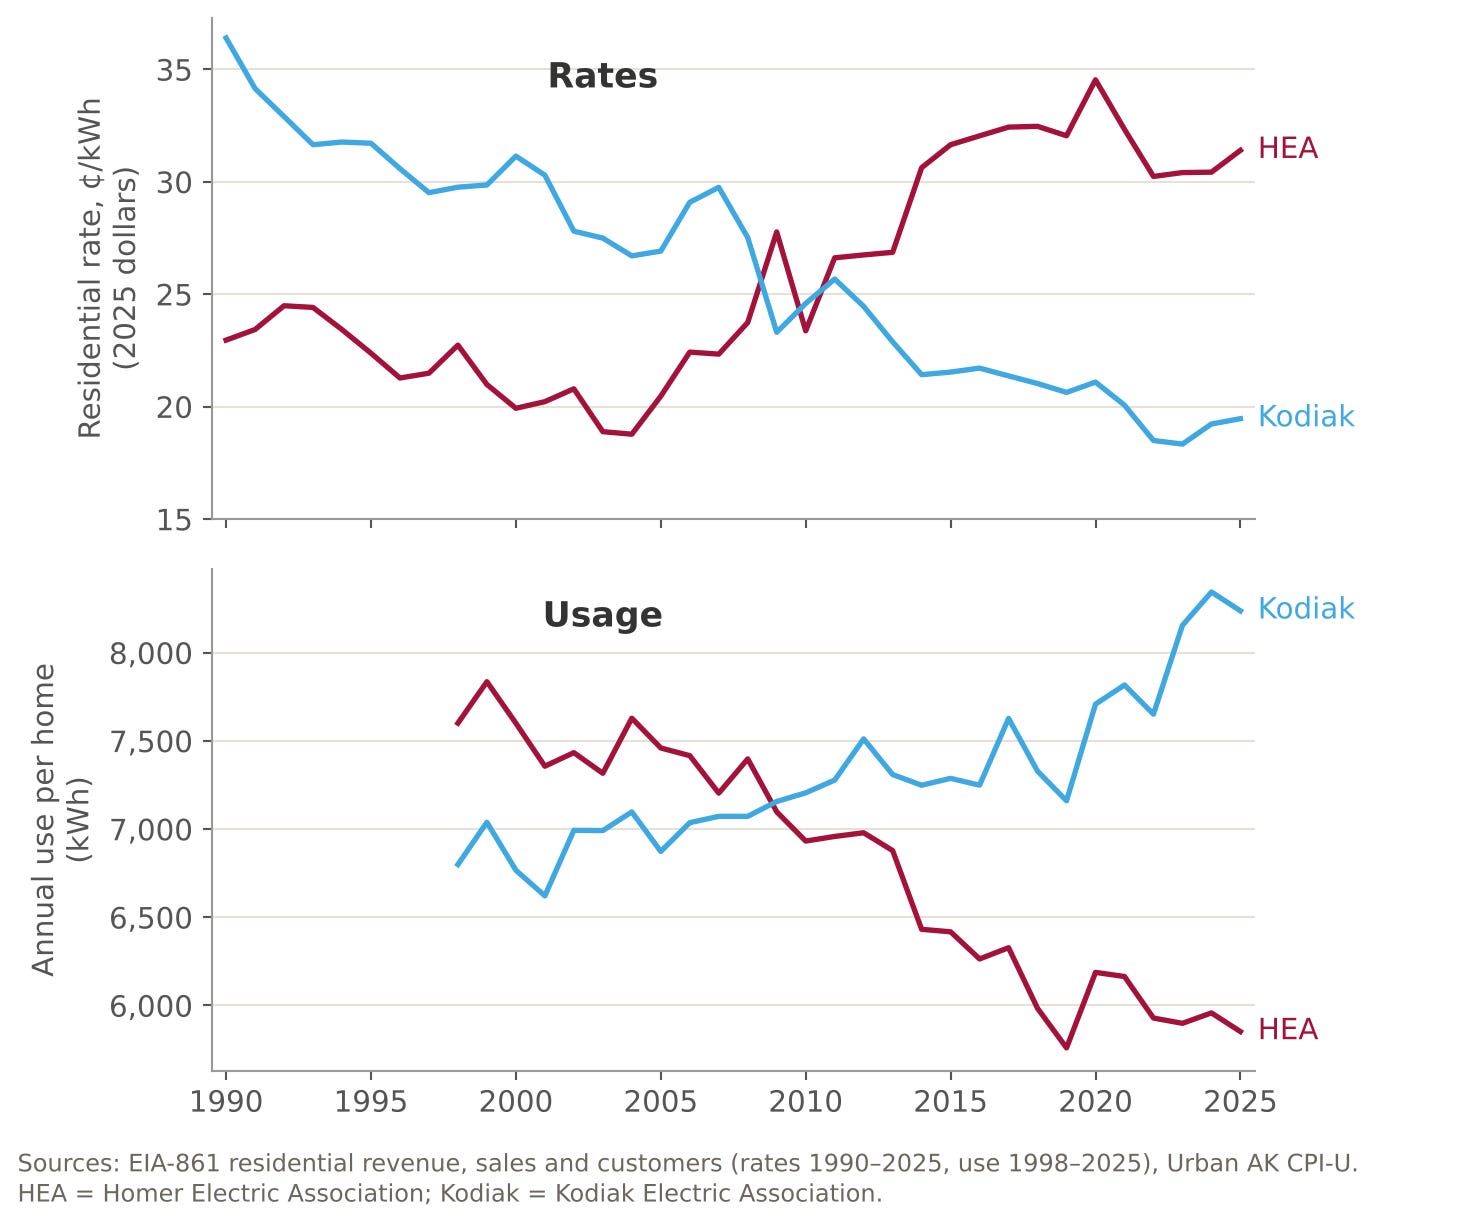
After adjusting for inflation, Kodiak (around 85% hydro and 15% wind) and Juneau (usually all hydro) have seen their rates trend steadily downward. Kodiak is particularly notable -- it was much more expensive than Railbelt power in the early decades, and is substantially cheaper today.
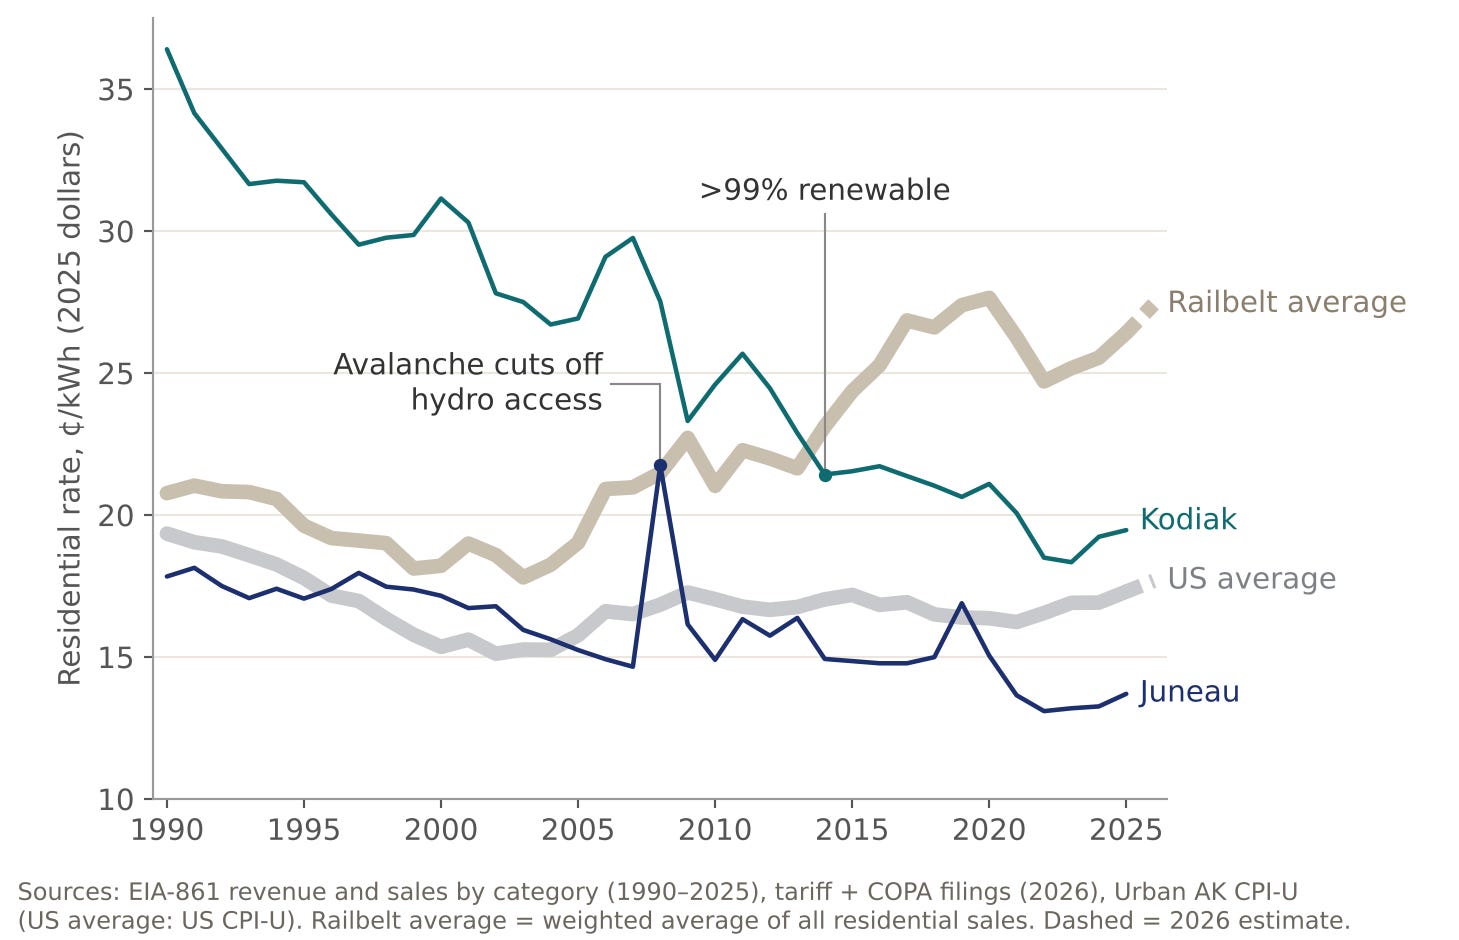
Railbelt power wasn’t always expensive. This graph also shows that in the 1990s, most people in Alaska paid rates fairly close to people in the lower 48.
Railbelt rate increases started with fuel costs, but continued with power plant costs
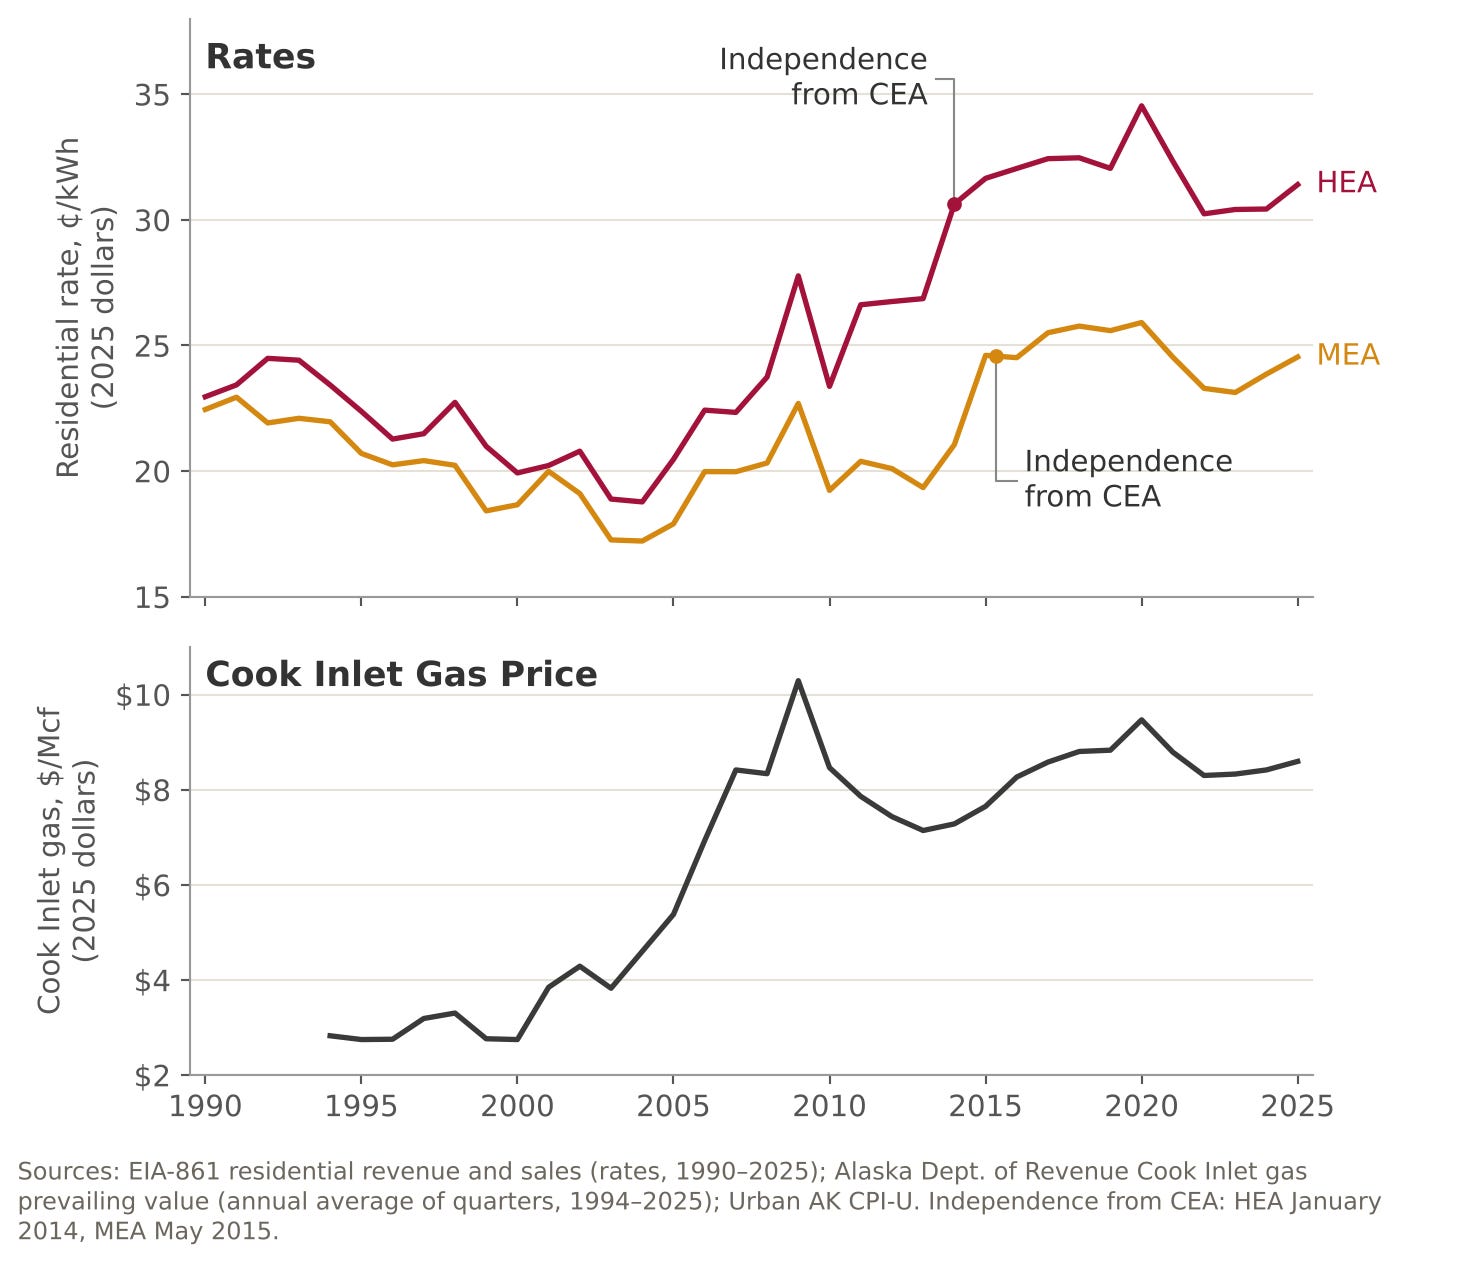
In the second half of the 2000s, both oil prices and Cook Inlet gas prices shot up. Rates shot up with them.
After 2010, oil prices continued to bounce up and down, while gas prices dropped, but never to their previous levels. Fuel costs flattened, while rates continued to rise.
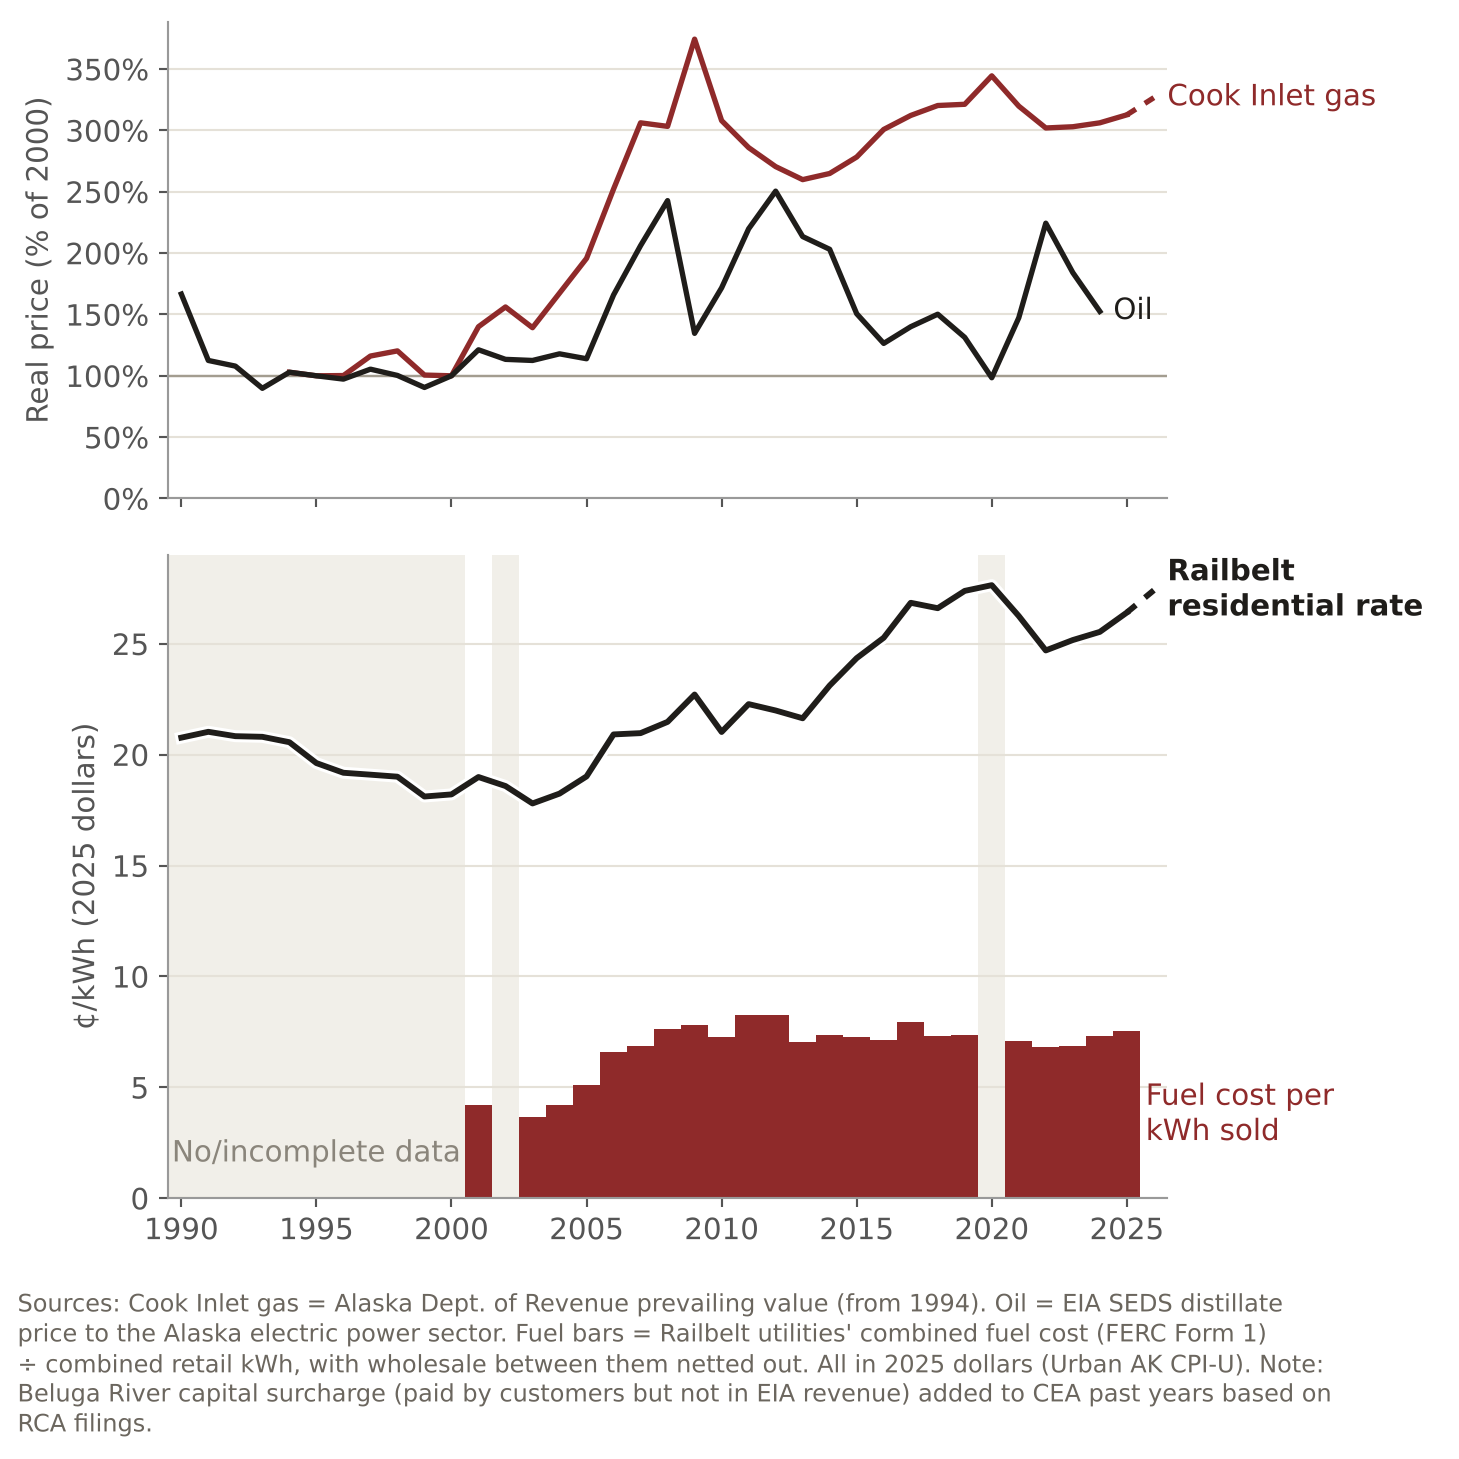
The 2010s saw a buildout of gas plants in the south and the restart of Healy 2 coal in the north. The new gas plants were more efficient. But the system cost more to own and more to operate. Depreciation and interest expenses rose to pay for the plants. And we also had to run them. By the end of the buildout, the Railbelt was paying over $65 million per year to run the new plants, while still paying around $14 million per year to keep the old ones going (non-fuel costs only).
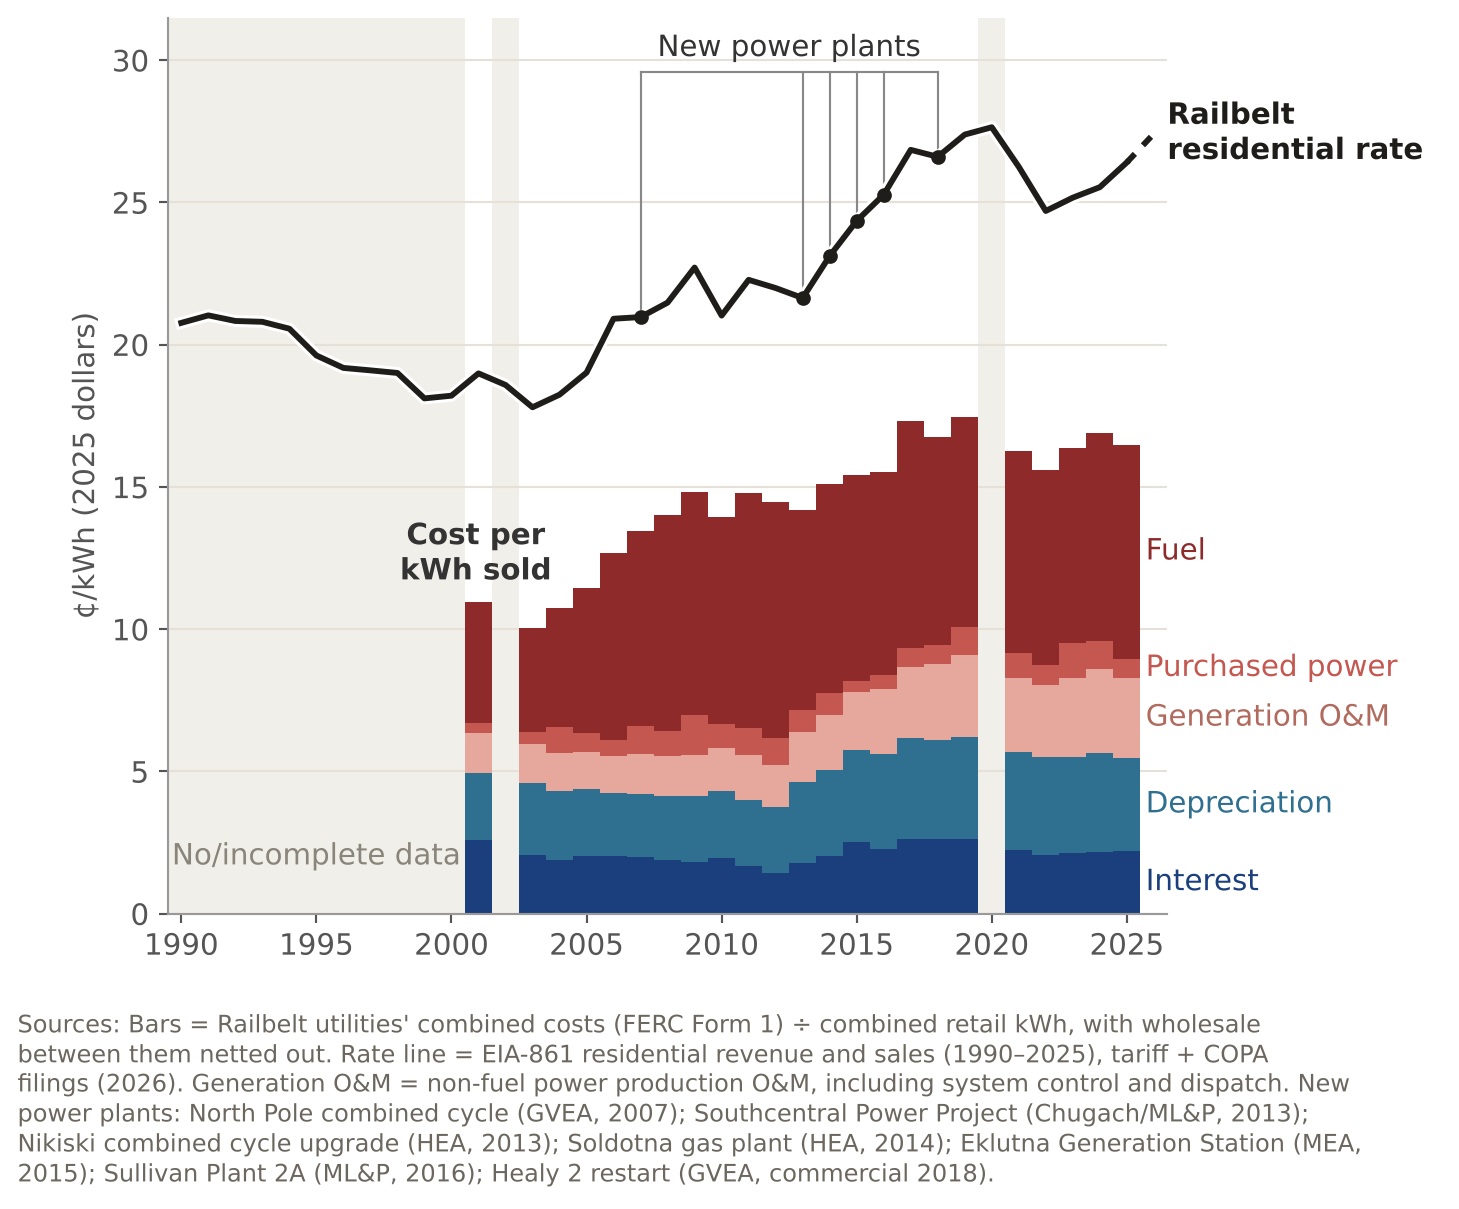
In this and subsequent ‘cost-stack’ graphs, the residential rate sits well above the cost of the components. This is partly because I haven’t shown all the costs -- only those where the changes were relevant or interesting. Also, since costs are system-wide, they will average rates paid by residential customers with lower rates paid by industrial and wholesale customers.
Our bills are still relatively low
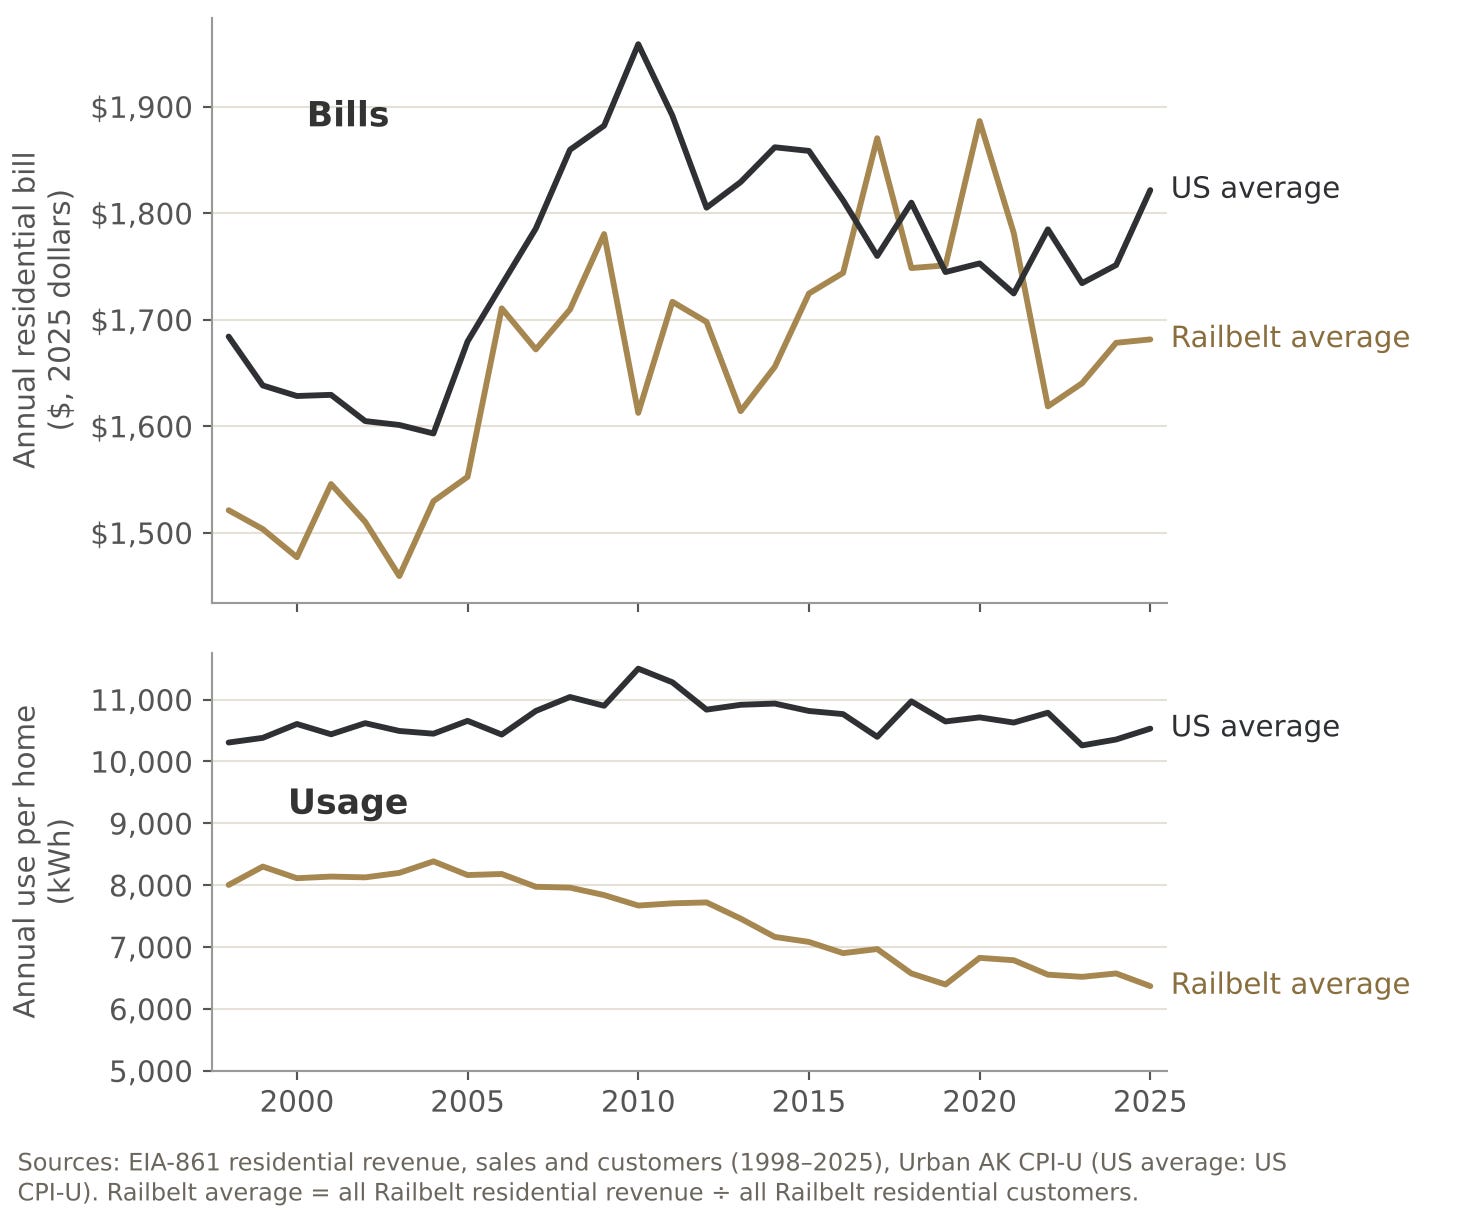
We pay less than most US households for electricity, because we use a lot less of it. Some of this is climate -- no air conditioning and not much electric heat. Some might be price-driven. As rates increased on the Railbelt, per-household consumption dropped dramatically, stabilizing bills. Meanwhile, utilities with falling rates didn’t see that pattern.
Kodiak vs the Kenai Peninsula is the most extreme example. The Kenai Peninsula is somewhat colder than Kodiak, and in the late 90s, households on the Kenai used a little more electricity. As Homer Electric rates rose and Kodiak rates dropped, that flipped. A Kodiak household now uses far more power than a household on the Kenai, with a steep rise in the last few years due to electrification. In 2010, only 8% of Kodiak houses heated with electricity, but by 2024, nearly a quarter did, probably through heat pumps.
Why did rates diverge?
Until the mid 2000s, there were only minor differences in rates between Railbelt utilities. After that, while rates rose across the board, they rose much more for GVEA and HEA than for the central utilities.
GVEA
In the early 2000s, Golden Valley electric rates were some of the cheapest on the Railbelt, and about the same as Juneau’s. Then around 2006, oil prices rose, and rates rose with them.
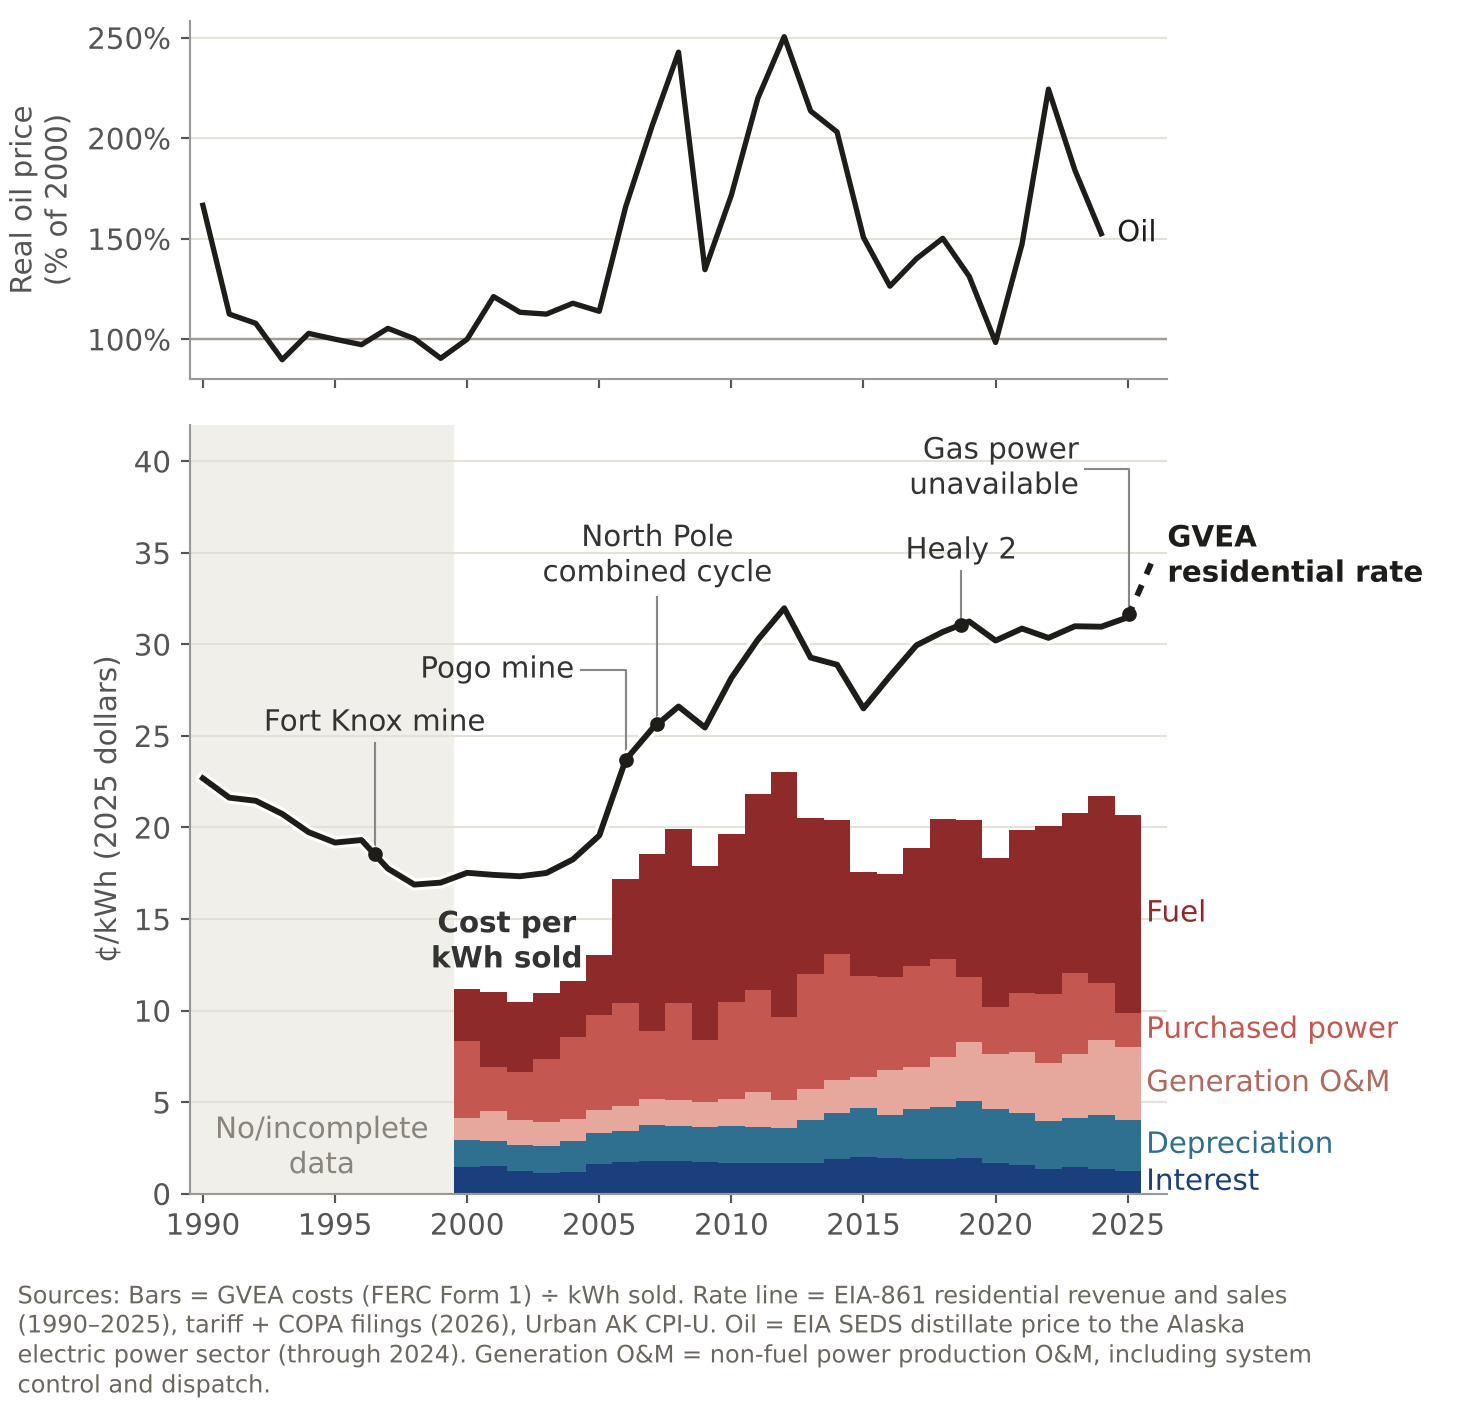
But while the fuel piece of GVEA rates is volatile, the residential rate often kept rising across dips in oil price, before stabilizing between 2018 and 2025. Part of this is that the gas power they bought from southern utilities never got much cheaper. And GVEA also added power plant costs. In particular, the restart of Healy 2 coal, which is expensive to run, significantly increased operation and maintenance costs.
This year, GVEA rates are shooting up again. The premium GVEA customers pay for their more expensive generation has been about the same since the mid-2000s, and annual bills have been fairly flat across that time. But the combination of the current Cook Inlet gas crisis and the Iran-war-driven diesel prices is leading to another jump.
The intertie between Southcentral and Healy is nearly empty today, and as Gwen Holdman recently pointed out, that’s driving GVEA costs higher.
But while the intertie used to carry a substantial amount of gas-fired power GVEA purchased from southern utilities, the biggest dropoff in those sales came when GVEA restarted Healy 2 coal. That plant ended up roughly as expensive as the gas power it replaced. Now, the remaining gas sales have ended.
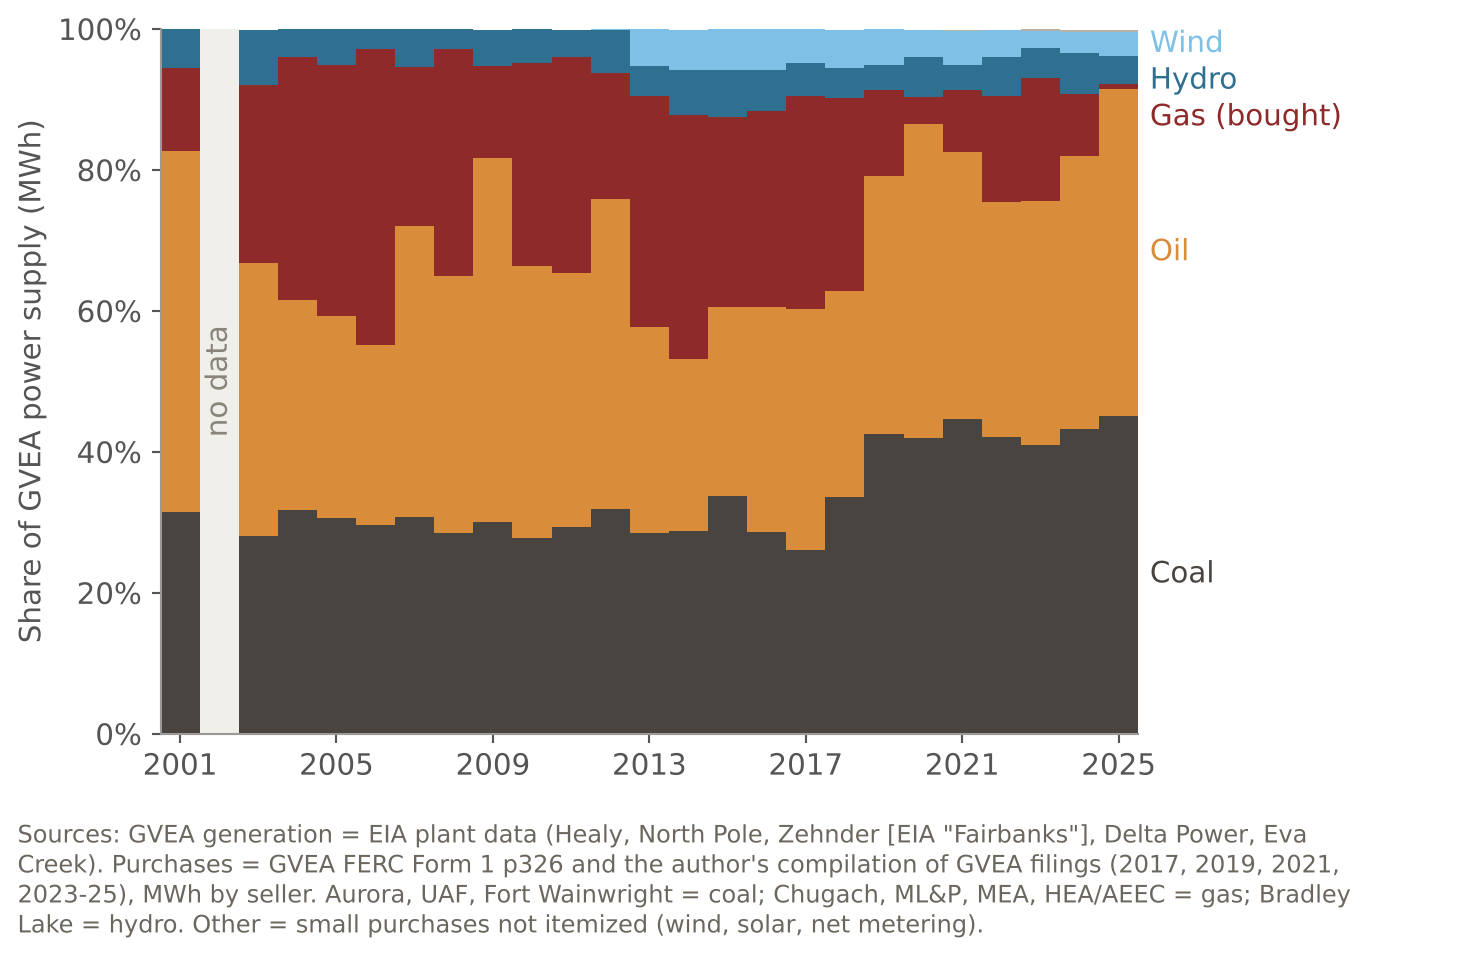
GVEA still pays most of the $2-$3 million per year to maintain that intertie, but only Bradley Lake hydropower now flows across it.
HEA and MEA
At first glance, these two utilities seem like they should show a similar trend. They generate most of their power from Cook Inlet natural gas. They started out getting nearly all their power from Chugach, then both decided to leave, building out their own new gas generation at around the same time.
Both HEA and MEA brought on new generation to replace what they’d bought from Chugach, decreasing their fuel and purchased power costs, but increasing their costs to run power plants (O & M), and to own them (the jump in depreciation and interest).
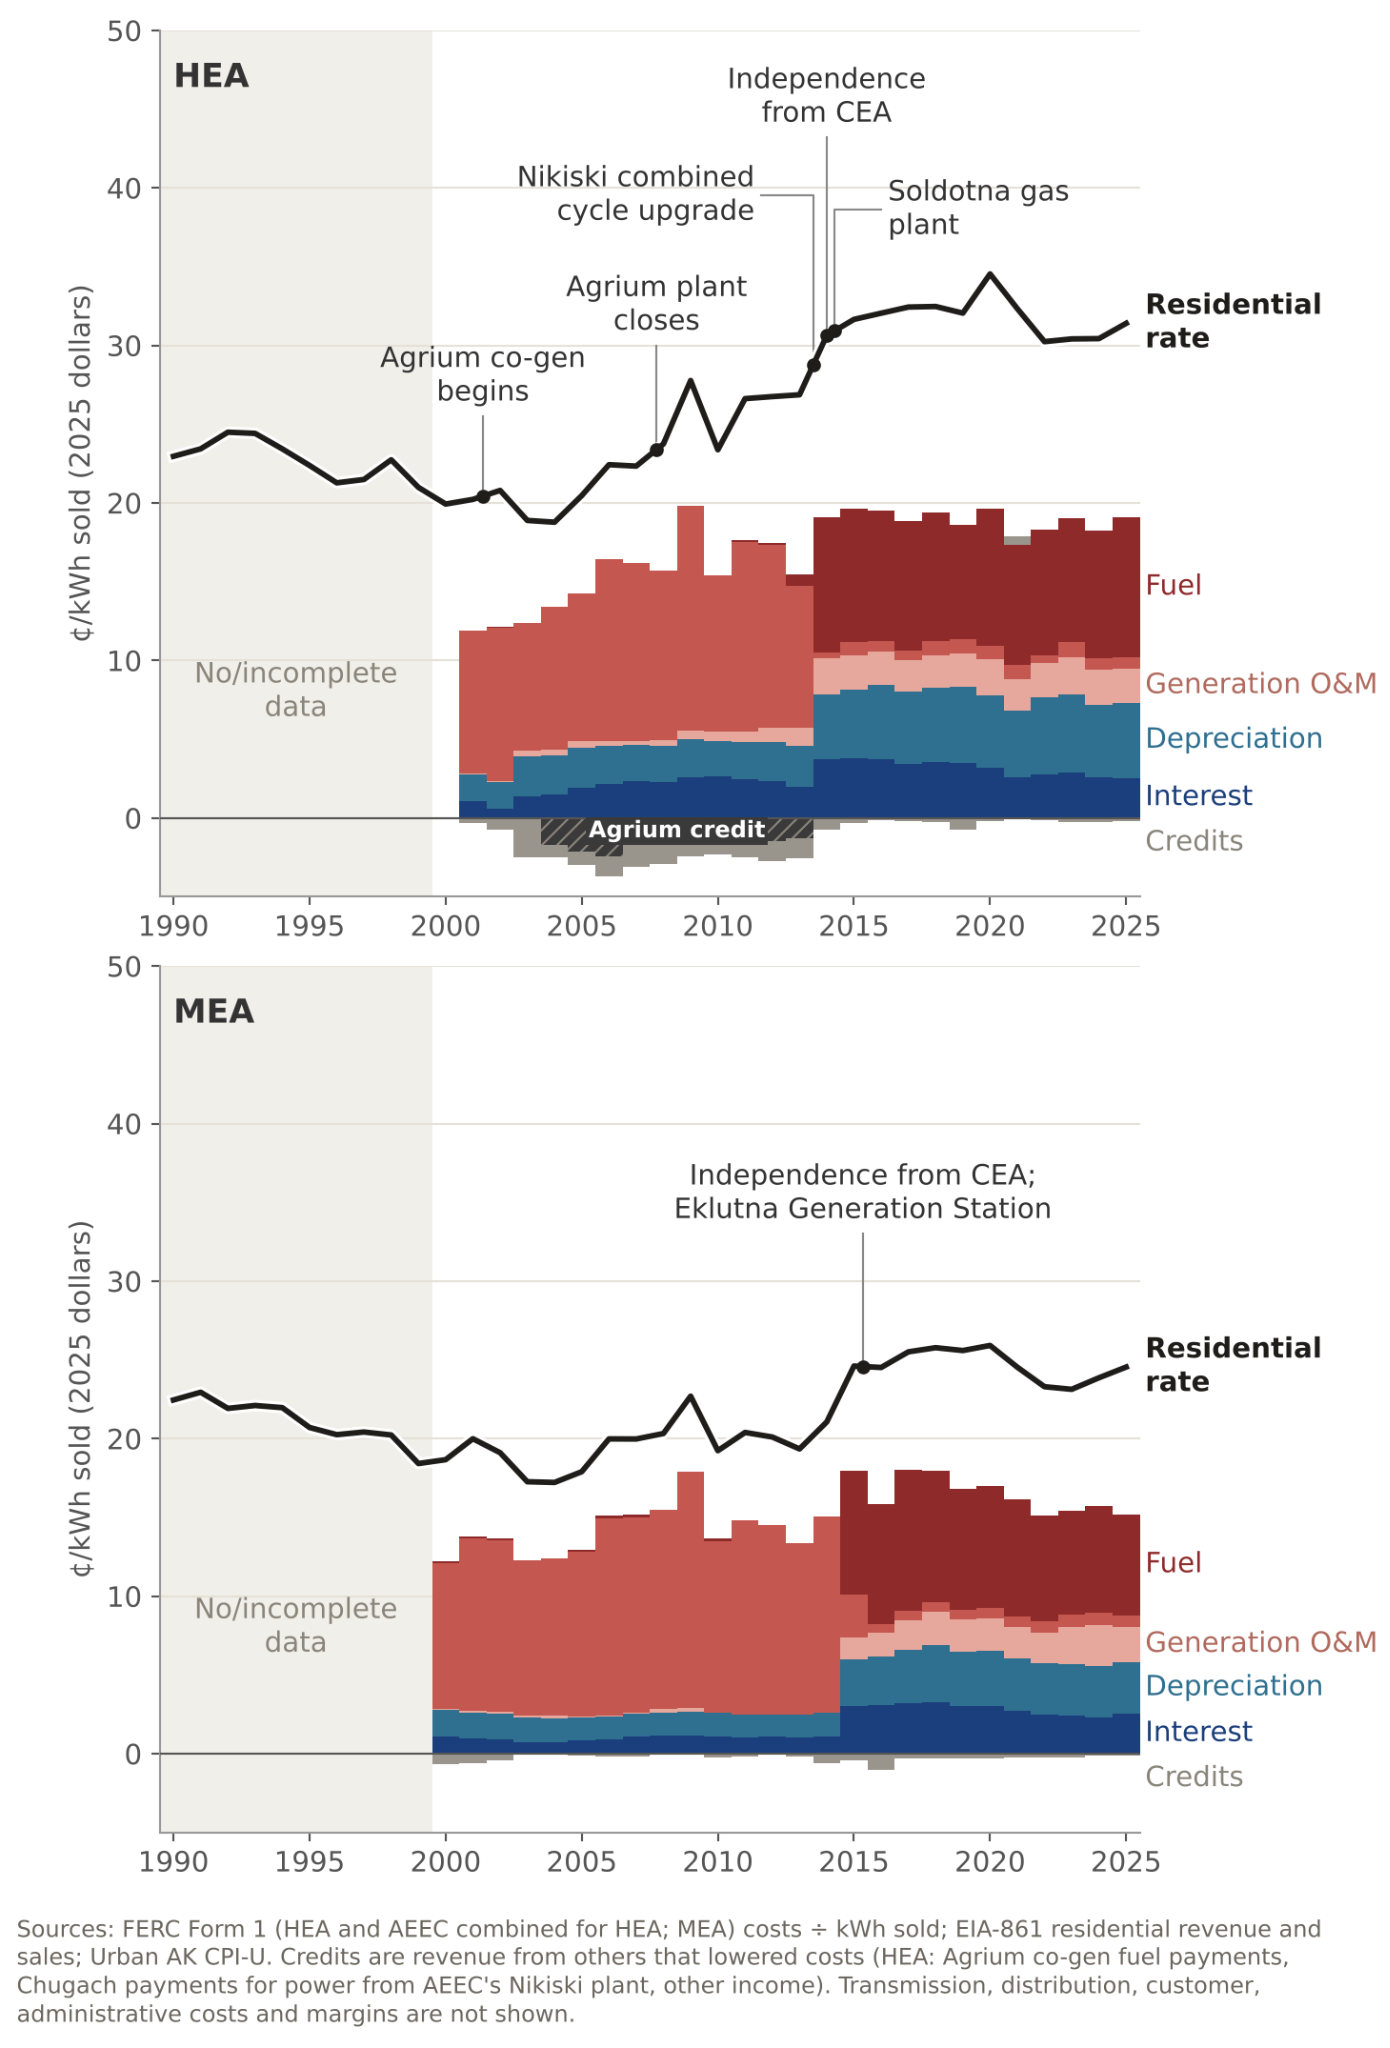
That shift lined up with rate increases for both utilities, and is the clearest signal in this time frame.
For HEA, it also lined up with a couple other factors. HEA already had higher depreciation, interest, and generation costs from its Nikiski power plant. But they got credits from CEA for that plant and had an agreement to sell the plant’s steam to the Agrium fertilizer factory. The credits from CEA ended because HEA became independent, and the payments from Agrium happened to end at the same time. Agrium was a victim of the first Cook Inlet gas crisis. It closed in 2007, but the remaining credits came back to members over time. So HEA’s new generation costs from going independent added to older generation costs that had been hidden by credits.
The biggest divergence between HEA and MEA is a little older, mostly between 2007 and 2013, and I’m still not sure what the explanation is -- many different pieces of the HEA stack rose a little faster while its sales fell.
CEA
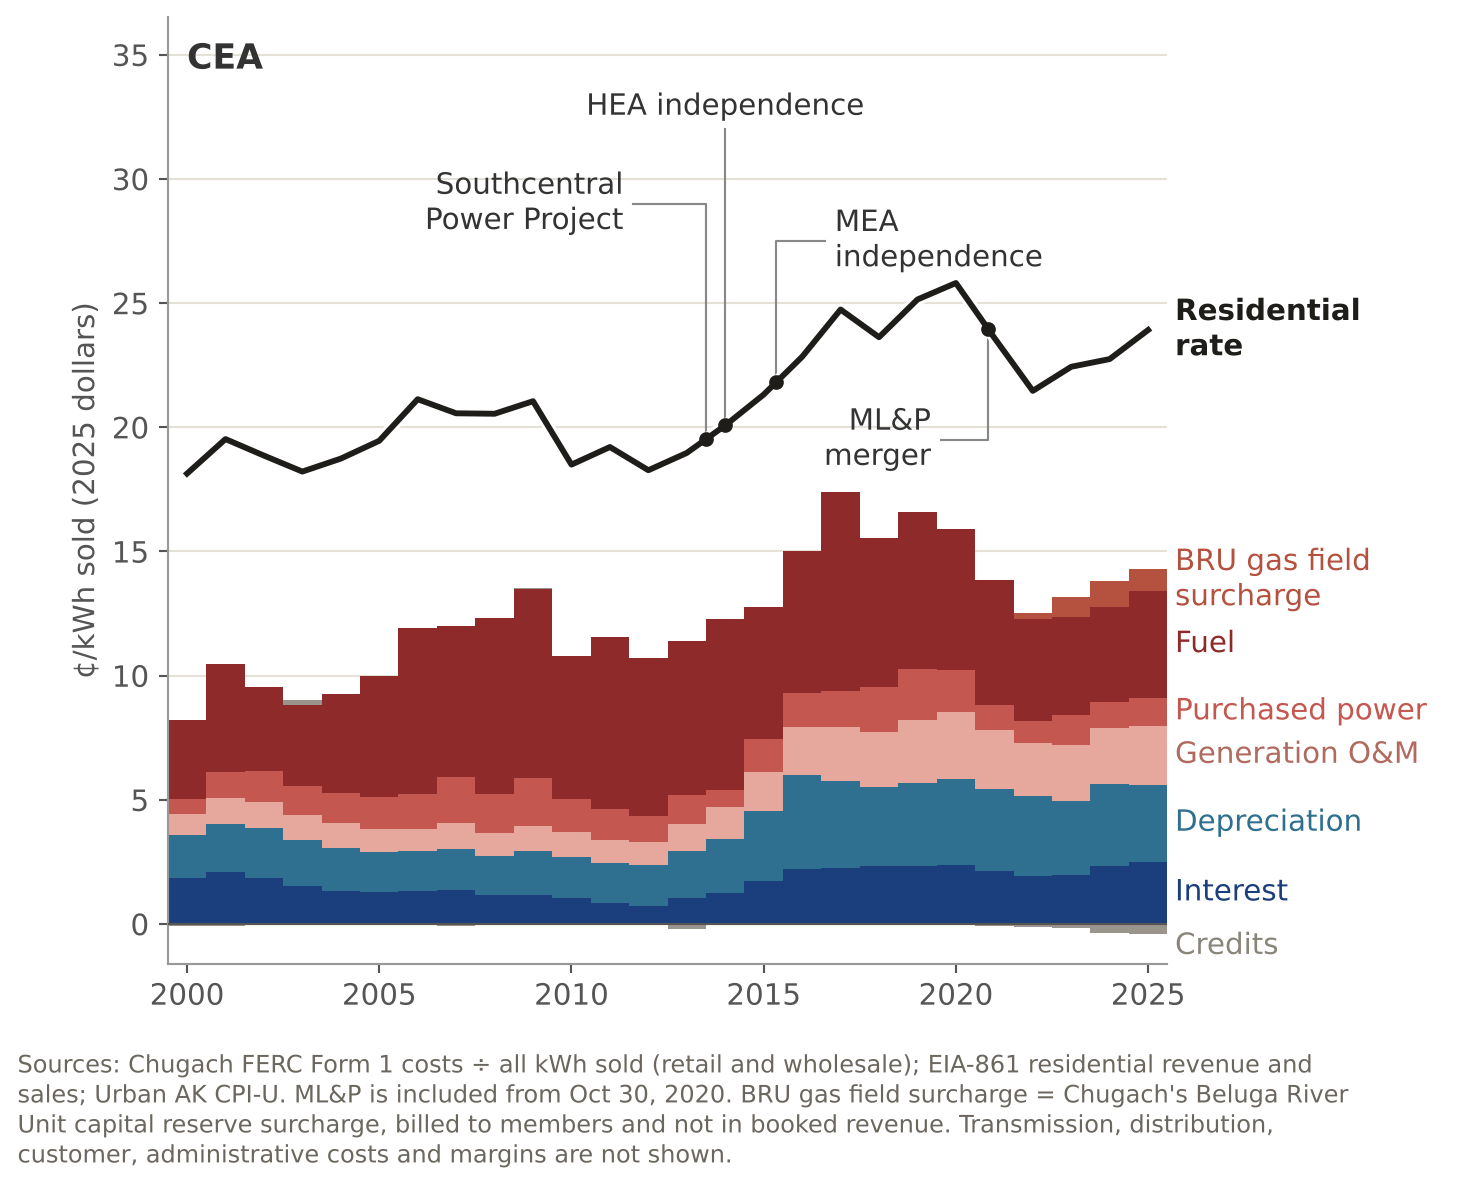
Chugach electric has gone through massive changes in who its customers are. Until the mid 2010s, it sold large amounts of wholesale power to MEA and HEA. More recently, it bought ML & P in 2020. Despite that upheaval, its residential rates have been a close match with its neighbor MEA the entire time, and show a similar pattern to the other gas-dependent utilities. It also built a new gas plant in the 2010s (and later acquired one that ML & P built), but the per-kilowatt hour impacts of that are hard to disentangle from the customer shifts.
Can sales levels explain the changes?
First, I have to explain why that’s worth asking. So far, I’ve been telling a story about costs. Utilities spend more or less -- their customers pay more or less. But electric rates are generally expressed as money per kilowatt hour. So the number of those kilowatt hours matters.
On the Railbelt, there’s no evidence that overall sales level has been a major differentiator. Of the four utilities, most have seen sales decline since 2007-2008, while MEA sales have climbed. (Combined Anchorage sales dropped, even though the merged CEA + ML&P sells more than CEA did alone). MEA’s rising sales and HEA’s falling ones may explain part of their pre-independence rate divergence. However, MEA rates have been almost the same as Chugach rates the whole time, despite their very different sales trends.
Unfortunately for the length of this explanation (and for the data center debate) -- sales level can definitely matter, in both directions, in complicated ways.
Is it better or worse for you if your utility sells more power?
On an individual level, you can save money by buying more electricity if it displaces a more expensive fuel (diesel or propane heat with a heat pump, gasoline with an EV). Otherwise, you save by buying less. Dramatic reductions in per-household power use are what held bills fairly flat while rates rose on the Railbelt.
If your utility sells more power to other people, this can be good if it leads to more use of infrastructure you’re already paying for, and bad if new costs to deliver that power exceed those benefits.
In the good version of this, you have a piece of infrastructure that can be used more without increasing its costs. A power line that can carry more energy or a power plant that can generate more energy with the same non-fuel costs. Increasing sales spread out those costs, making them cheaper for everyone.
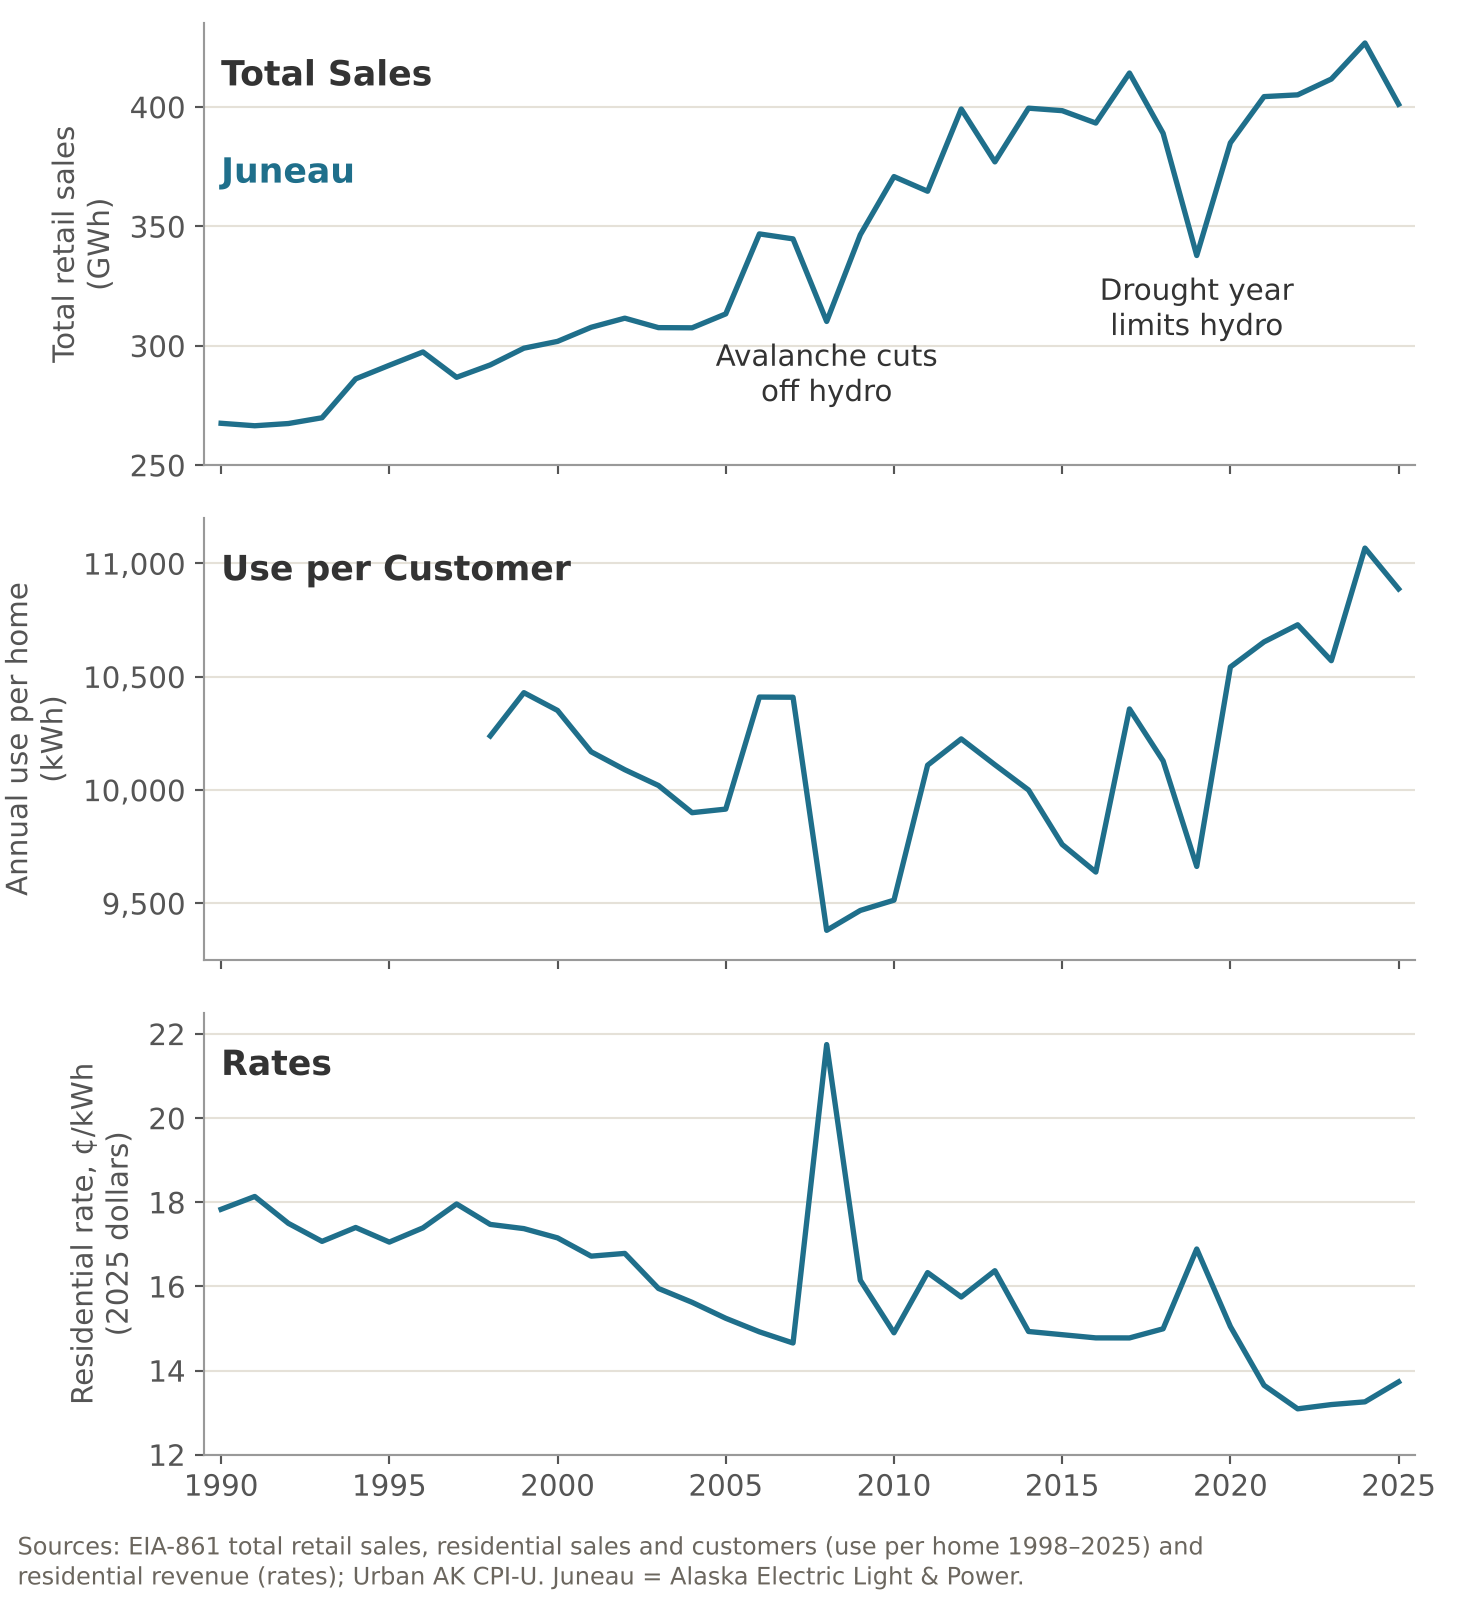
You can see some of this effect in Juneau. Juneau runs on hydropower, and when there’s enough water, they sell excess interruptible load to industrial users (getting more sales out of the same infrastructure). In 2019, there was a drought, those sales didn’t happen, and residential rates rose. Of course prices also impact use (high rate years see lower per-customer use), so it can become a feedback loop that’s difficult to untangle.
In the bad version of this, the increased sales cross a threshold where you need to buy a new piece of infrastructure, use an inefficient plant, or switch to a more expensive fuel -- and those new costs exceed the gains.
One current example is at GVEA, where an increase in industrial load is lining up with an inability to buy gas-fired power from southern utilities. This makes day-to-day power generation more expensive during peak times, by forcing GVEA to run old and inefficient plants on expensive diesel fuel -- which all customers pay for. And it also might drive them to buy a new gas turbine for over $80 million dollars, right as the data center boom is making those turbines very expensive.
Kodiak is another example. Kodiak right now is a success story -- declining rates, no fuel costs, and residents increasingly using electricity to displace the expensive diesel they were using for heat. But increased loads from planned military expansion would exceed the capacity of their wind and hydro, forcing them back onto diesel, and making their current customers pay the costs of the new generators and the fuel to run them.
The potential effects are somewhat asymmetric. If people start buying less power you can’t un-buy extra infrastructure, so any truly fixed cost will get more expensive. But you can stop running expensive plants, potentially even retire them, and buy less fuel. This is particularly important if fuel costs are not all the same. Imported LNG is expected to be much more expensive than current Cook Inlet gas, so using less power now can stretch out that cheaper fuel over more years, or leave more available for heating.
What have we learned?
Utility strategies:
Kodiak took the roughly 20% of their grid that was run on diesel, and entirely replaced it with wind, batteries, and expanded hydro. More than replaced it, since their total sales are higher now. Their depreciation and interest costs rose to pay for the new infrastructure, but their fuel costs shrank more.
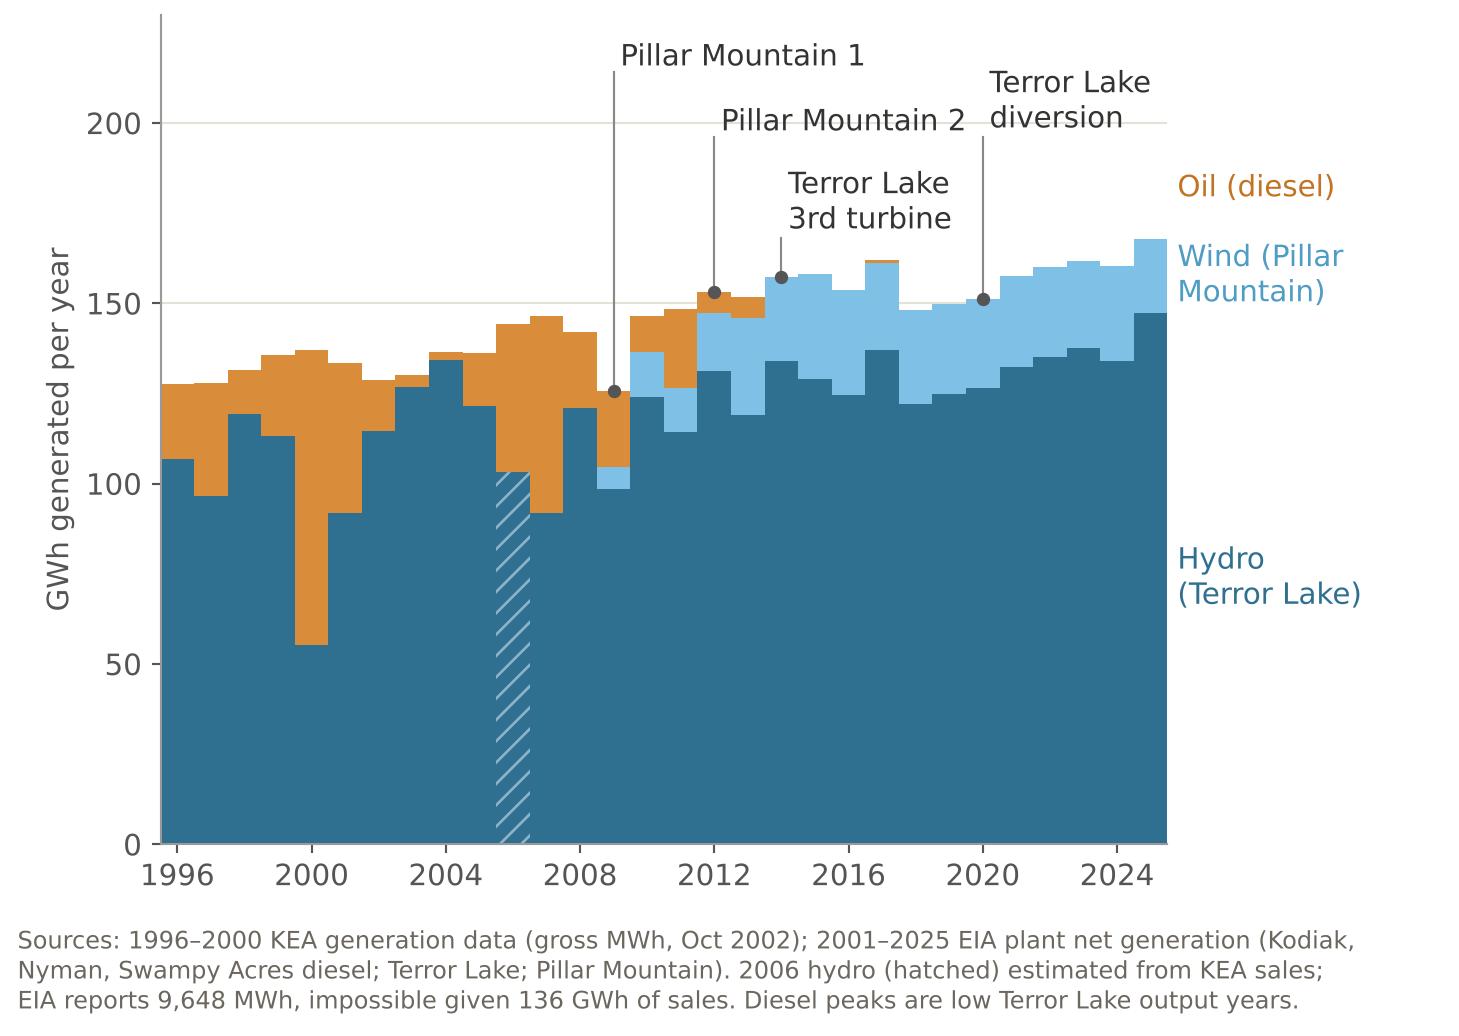
The Railbelt utilities did replace a small amount of fuel-fired power with wind (2%) and increased hydro (1%). But most of the spending went to fuel-based plants -- primarily to more efficient gas plants. Our current gas fleet uses 20% less gas to produce a kilowatt hour than the old fleet did, and has saved around 15% of the gas we used to burn. So far, this strategy hasn’t saved money overall.
While Kodiak is pretty much using all of its fuel-saving investment, and is worried that new government load could exceed their renewable capacity, the Railbelt built more than it’s using today.
Why was power plant efficiency a less effective strategy? All those new power plants saved gas -- hundreds of millions of dollars of it -- but rates went up because each one saved much less than it could have.
A new renewable project that generates around 20% of your power saves nearly 20% of your fuel. A power plant that can make a kilowatt hour with 20% less gas also saves around 20% of your fuel -- but only if you’re using it to make the same amount of power.
Which is why the fleet that burned 20% less only saved 15% of the gas -- we didn’t use the new plants as much as we’d used the old ones. And it gets worse from there. There are pretty strong limits to how efficient you can make a fuel-burning power plant. So if you then want to save more fuel, you have to use those plants less, while continuing to pay for them.
But payback periods presented to utility boards usually assume that new plants are going to be used heavily into the indefinite future. HEA just bought an upgrade for one of their gas plants, and GVEA is planning to buy a new gas/oil plant, under those same assumptions.
So while we ended up upgrading or replacing a lot more gas capacity than we were using, it would have been smarter to upgrade significantly less than we were using. To explain in simple numbers, imagine that we had 10 old inefficient gas turbines, and were using 7 of them. Instead of building or upgrading 10, we should upgrade 5 -- then max out their use while replacing the two crappy ones with non-fuel-dependent power.
State Strategies
Utilities aren’t making all the decisions. State policy has also played a large role in directing our energy system.
AEA in 2008 created the Renewable Energy Fund. By 2023, it had spent around $275 million around the state. AEA’s report cites gross energy savings of around $350 million and net savings of $50 million across that time frame, with most of those projects on track to continue to save fuel well into the future.
Around the same time, the state created a set of incentives for Cook Inlet oil and gas producers which paid out (mostly in cash) $1.6 billion dollars between 2010 and 2024. The credits were intended to prop up gas for both heat and electricity in Southcentral. If we assign a percentage of that money to electric utilities proportionate to their gas bills, the state spent over $700 million to prop up gas availability for Railbelt electric utilities -- around half the capital costs of all the generation built in the Railbelt over that time.
What next?
It’s kind of 2008 all over again. Cook Inlet gas is in crisis, oil prices are high, bills are going to go up, and the state budget has a bit of money to spend because oil prices are up. And utilities are planning to sink more money into expensive fuel plant upgrades rather than non-fuel generation.
It’s a good time to try again to use less fuel, by getting more power from fuel-independent sources. On the Railbelt, now that we have the more fuel-efficient gas plants and a bunch of batteries, we can use them to balance whatever other power we bring on. The Railbelt may not have Kodiak’s enviable starting point, but there’s no reason it can’t reduce a similar portion of its own fuel-fired power. We might even be able to shut down some of the inefficient and almost-never-used plants.
State politicians sometimes talk about “encouraging” or “supporting” Cook Inlet gas. We should be leery of public spending that doesn’t lead directly to tangible benefits. At best, we kicked the can down the road a decade with our billion and a half dollars. We’d be better off if we were less dependent on oil and gas.